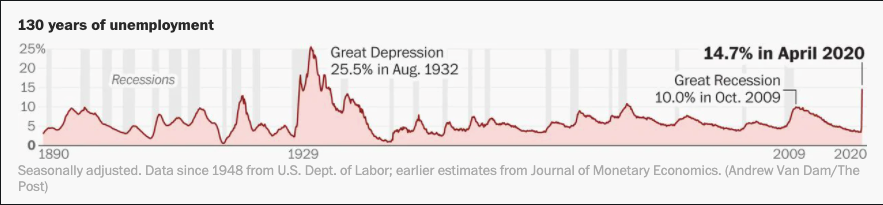
The employment report on Friday was (expectedly) horrifying. 14.7% of the work force is now unemployed. The most interesting chart I saw with regards to unemployment came from @adrewvandam (h/t @byheatherlong). It showed that this is the highest unemployment rate since the Great Depression. I have copied it below.
When looking at a chart like this it appears quite shocking. 14.7% unemployment can’t be good for the economy, and most people would think that the stock market would be struggling mightily in the face of such a number. But the SPX has now risen nearly 31% in the 33 trading days since the March 23rd bottom. Using S&P 90 data as a substitute for the S&P 500 pre-1954, I looked back to 1928 to identify other times the SPX has risen > 30% in 33 days. There have only been 3 other instances. All during the Great Depression. They were in 1938, 1933, and 1932. I have produced charts of those periods below. Let’s start with 1938.
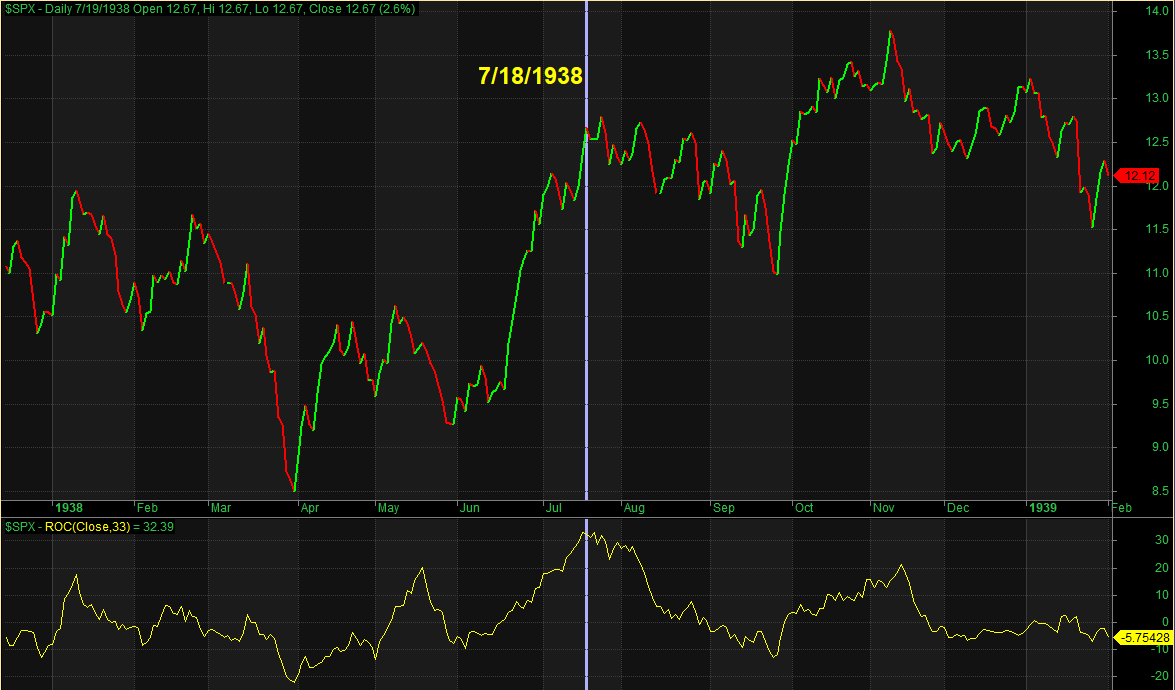
The vertical line is the date that the 33-day rate-of-change 1st exceeded 30% (7/18/1938). The 33-day rate of change can be seen on the bottom of the chart. This 33-day rally in 1938 was basically it for that move. It immediately began chopping lower for the next few months. Next let’s look at 1933.
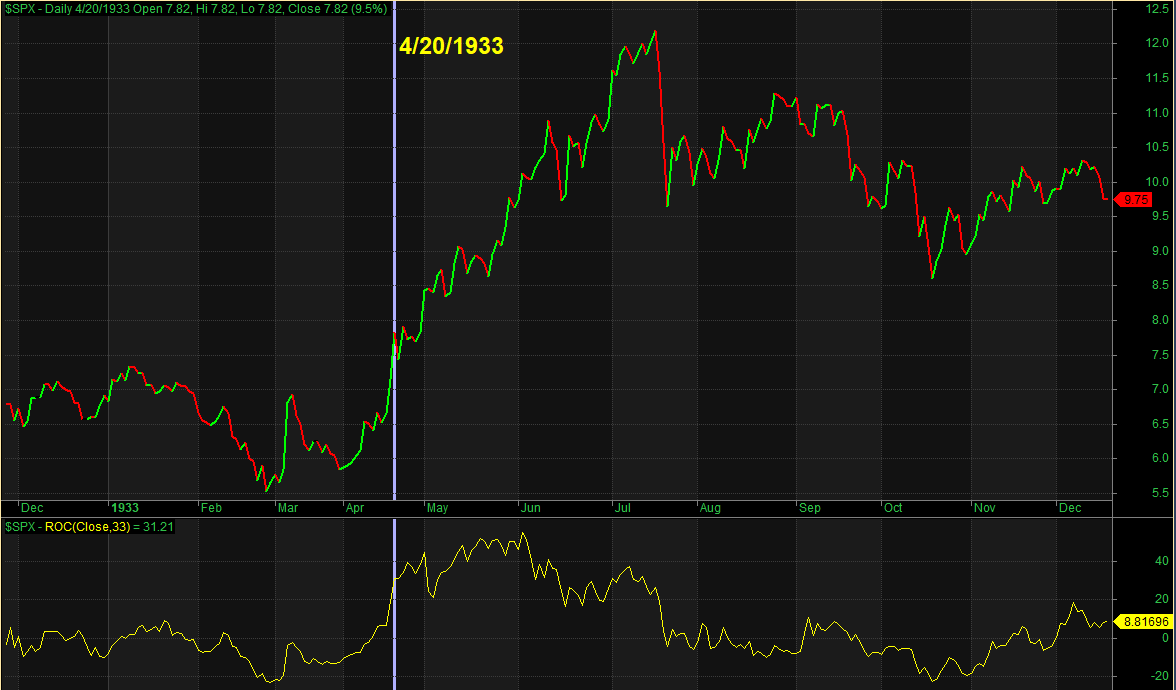
April 1933 was followed by significantly more rallying over the next few months before the next bear market emerged starting in July. Lastly, let’s look at 1932.
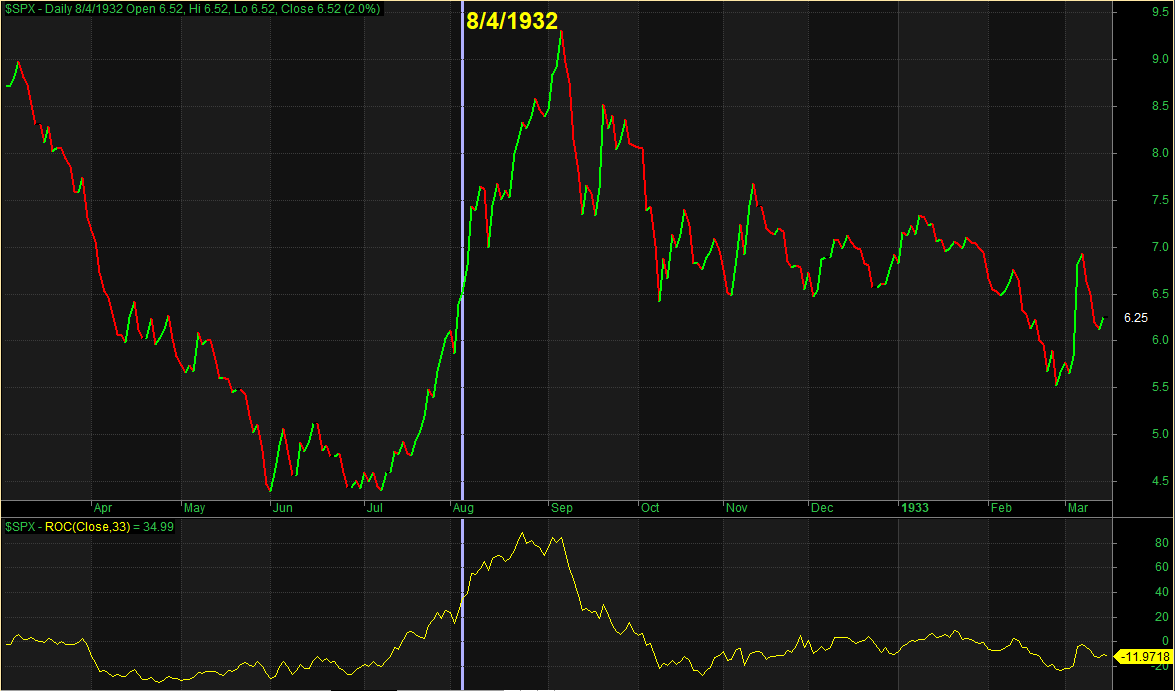
As you can see, there was plenty more upside over the next month and a half before the index gave back most of the gains. Incredibly, the 33-day rate-of-change actually spiked up to over 80% at one point during August of 1932. Bottom line with the instances shown is that the market was wild and it seemed to remain wild for months to come. Now let’s recall the 1st chart I showed, with the unemployment data. Do you recall where the unemployment data hit its peak during the Great Depression? It was August of 1932. And from early July to early September of 1932 the SPX rallied over 100%.
The market has had a massive decline (like none seen since the 1930s), followed by a massive rally (like none seen since the 1930s). We have unemployment like none seen since the 1930s. Outsized declines and outsized rallies could very well persist for many months, if not years, to come. Being able to remain nimble, open-minded and adaptive to changing conditions may be more important over the next several years than it has been for a long time.
Want research like this delivered directly to your inbox on a timely basis? Sign up for the Quantifiable Edges Email List.