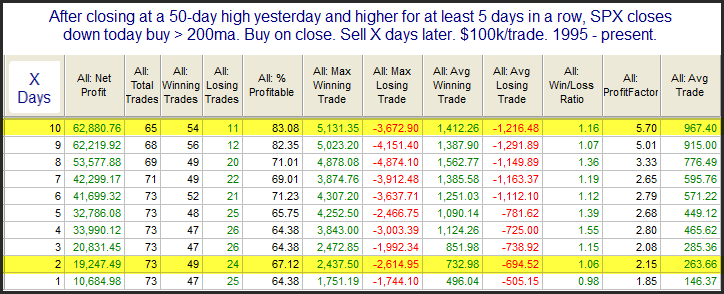
One compelling study that triggered Tuesday in the Quantifinder suggested the recent persistent upmove is unlikely to abruptly end. (This is a theme we have seen many times over the years.) It considers what happens after the market moves up at least 5 days in a row to a 50-day high, and then pulls back.

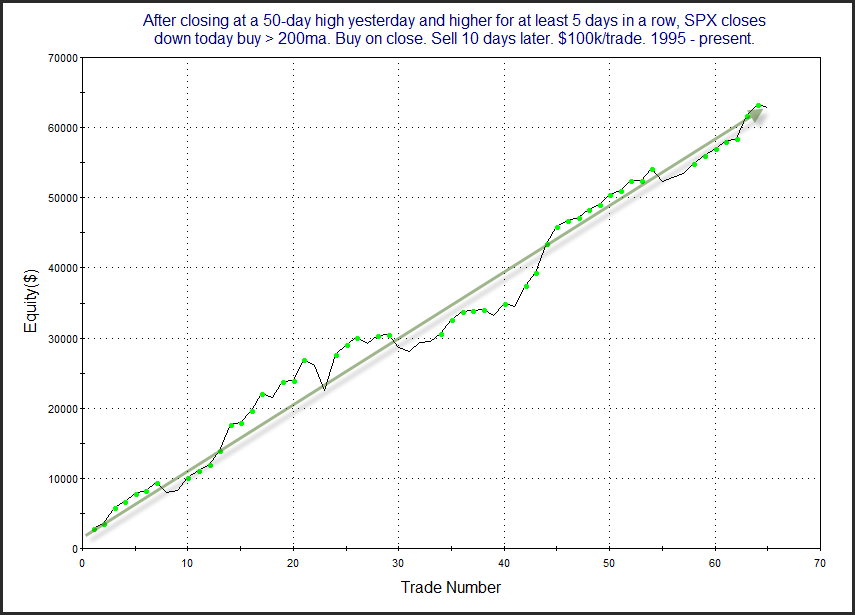
We see here a decent edge that becomes stronger and more consistent as you look out over the next several days. The 9-10 day time frame shows exceptional stats. The 2-day timeframe suggests a short-term boost is also likely. Below is a look at the profit curve for the 10-day holding period.

The strong, steady upslope is impressive. The market is long overdue for a temporary pullback. But evidence like this suggests any dip in the coming days is likely just temporary. Traders may want to keep this in mind as they determine their bias over the next 1-10 days.
Want research like this delivered directly to your inbox on a timely basis? Sign up for the Quantifiable Edges Email List.
Learn how to identify edges and formulate swing trading strategies with the Quant Edges Swing Trading Course!
