According to Investor Business Daily, not all Follow Through Days signal the start of a huge market rally, but no market rally has ever begun without one. Today I am going to put this to the test. For those who missed my first few posts on quantifying the IBD Follow Through Days you may find them here:
1) Do IBD Follow Through Days Provide A Quantifiable Edge? (Intro)
2) IBD Follow Through Days pt. 1 – Are They Predictive?
My first inclination when reading this claim is that it reeks of false bravado. I went to the Celtics game last night. Since the beginning of the franchise, the Celtics have not won every game in which they scored at least four points, but they’ve never won a game without scoring at least four points. And while their franchise winning percentage of 58.7% is better than IBD’s Follow Through Days success rate, I did not feel the game was well in hand when they took a 4-2 lead.
To be fair, scoring 4 points in a basketball game is much less significant then a 1% (or 1.7%) move in the market. Still, I could hardly fathom a market rally that at some point didn’t have an up day of at least 1% on increasing volume.
One difficulty in testing IBD’s claim is that over time they have changed the percent rise required for a follow through day. Whereas it was originally 1%, it now stands at 1.7% (and for a while was 2%). My biggest issue with this is that I was able to find no reasonable explanation for the change. One article cited “changing market conditions”. Increased volatility was another explanation I’ve heard in the past, but that simply doesn’t hold water.
If you take a 50 day moving average of the Hi-Low percentage change in the S&P 500 ((Today’s high – Today’s low) / Yesterday’s Close) you’ll get a current result of about 1.66%. During the period between 2000 and 2002 when the Follow Through Day requirement was increased from its original 1%, the Hi-Low Average was oscillating between 1.2% and 2.3% – around where it is now. Looking back in history, though there were periods where this was low. From 1980-83 for instance, the number was above today’s 1.66% the entire time and reached as high as 3% in December of 1982. If a 1% Follow Through Day was appropriate then based on volatility, it should also be appropriate now.
In William O’Neil’s 2002 edition of “How To Make Money In Stocks” (page 65) I was able to find the following explanation:
“I used to use 1% as the percentage increase for a valid follow-through day. However, in recent years as institutional investors learned of our system, we’ve moved the requirement up to 2% to minimize professionals manipulating a few stocks in the Dow averages to create false or faulty follow-through days.”
No further explanation is given as to why by 1995 his book had sold over 1,000,000 copies but it still took institutions 5 more years to learn of his system and conspire against it. Or why institutions should want to “create false or faulty follow-through days”. What would seem more logical is that the 2000-2003 bear market contained sharp bear-market rallies that created a multitude of false signals. IBD perhaps needed to do something to maintain readership. Changing the Follow Through Day requirement would be one way to handle it. Unfortunately, raising the required percent increase from 1% to 2% at the 2000 top still would have only reduced the number of failures from 7 to 5. After moving the requirement, they never backed off the claim of no bull rally ever occurring without a follow through day.
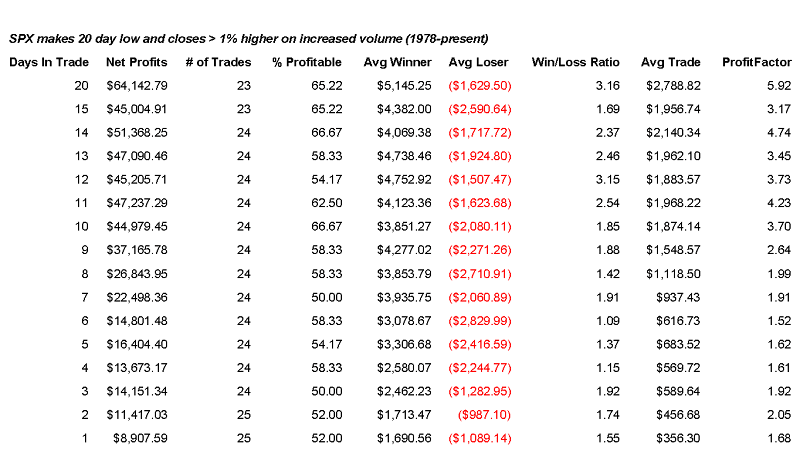
Since I ruled out increased volatility as a reason for the change and I’m not sure what to make of the institutional conspiracy theory, I decided to test the claim using both the 1% and 1.7% percentage increase measures. Here is what I found:
Using the 1% requirement and looking back to December of 1971, the claim generally seems to hold true. While the Follow Through Day sometimes may have come a bit late and missed a significant portion of the move, there were no bull rallies that I could find that didn’t contain a Follow Through Day at some point.
The 1.7% requirement would have missed or mostly missed several bottoms. Since 1971, these are the ones I found:
August 22, 1973 – The S&P 500 hit a low point of 100.53. Five trading days later (8/29/73) there was a 1.3% Follow Through Day. The market rallied for about two months until 10/26/73. The total gain over the two month span was nearly 11% and the 8/29 Follow Through Day would have caught a decent portion of it. Based on our test as described in Part 1, it was labeled a “success”. Had you waited for a 1.7% Follow Through Day, that didn’t arrive until Day 19. You would have missed out on 49% of the rally and the FTD was a “failure” based on our test criteria since a new high was not made and the FTD failed to deliver gains equal to at least twice the size of the move already made off the bottom before undercutting the rallies lows.
October 30, 1978 – From early September to late October 1978 the S&P 500 lost over 15% from high to low. On December 1st a “1% Follow Through Day” triggered. The market rallied until October of 1979. If you waited for a 1.7% Follow Through Day, that didn’t come until the Dow posted one on 3/27/79. About 5 months and a 12% move after the October bottom.
March 9, 1982 – After a lengthy decline, the S&P 500 hit a low of 106.16 on this day. A 1% Follow Through Day triggered on March 18th that was able to catch a good chunk of the move up to 120.55. The two month market rally was good for a 13.6% rise. If you waited for the 1.7% Follow Through Day on March 22nd you would have missed 46% of the move.
August 4, 1986 – July of 1986 saw a fairly strong selloff. The market bottomed on August 4th after dropping just over 8%. On August 11th a 1% Follow Through Day triggered. The rally was short-lived as the market once again topped out in early September. Before topping out though it did manage to hit new highs. The 1.7% Follow Through Day came on 8/26/86 – the same day the market closed at a new high! Obviously if you’re trying to catch a bottom, you’d like to do it before the market hits a new high.
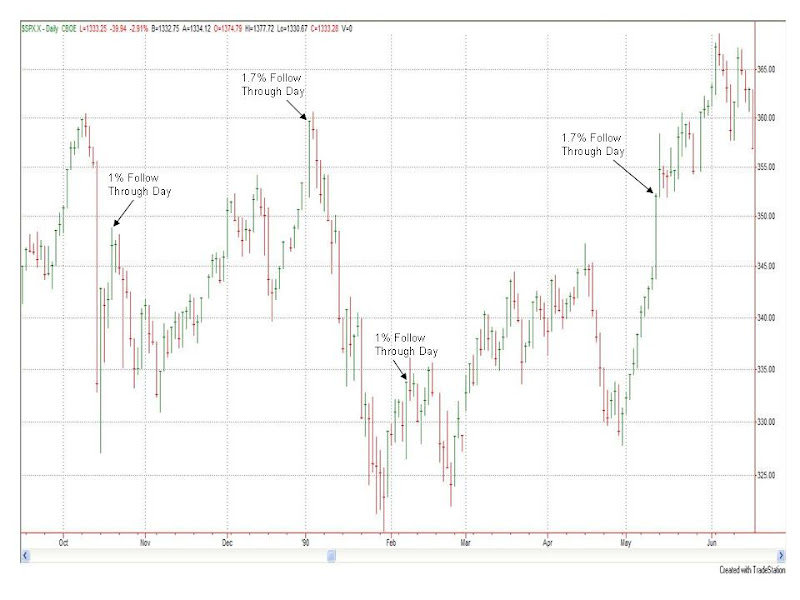
October 16th 1989 – The market spent about a week scaring people as it dropped over 9% from high to low. On October 19th it posted a 1% follow through day. The 1.7% Follow Through Day didn’t occur until January 2nd. On January 2nd the S&P 500 closed within 1 point of new high. So much for catching the bottom. It then peaked the next day and sold off 11% by the end of the month. Which bring us to the next missed bottom…
January 30th, 1990 – A 1% Follow Through Day triggered on Day 6 of the rally. The S&P 500 rose until mid-July, gaining over 15.5% along the way. The 1.7% Follow Through Day occurred on May 11th – three and a half months into the rally. Waiting for that would have missed 2/3 of the total rally. Below is a chart of the 1989-90 Follow Through Days.
October 28, 1997 – In the fall of 1997 the S&P 500 lost over 13%. On November 13th a 1% Follow Through Day occurred. The market put in a nice long rally. The 1.7% Follow Through Day didn’t trigger until December 1st when the S&P 500 was within 1% of a new high – once again confirming the bottom when we reach a new high.
Summary
If you want to use the IBD Follow Through Day as a technical tool and be sure not to miss a bull rally, then it appears the old 1% increase requirement should be used instead of IBD’s current 1.7% increase requirement. Looking back to 1971, at least 7 bull moves would have been either missed entirely or the FTD would have arrived too late to provide much value. This means over the last 36 years or so the IBD Follow Through Day in its current incarnation would have missed out on about 20% of the total market rallies we identified in this study.
Whether the 1% Follow Through Day consistently comes early enough or whether it misses too much of the move is another question. And it will be the topic of the next part in this series…
Regards,
Rob Hanna
One last quick note – The above should not be taken as a criticism of the IBD method of investing as a whole. The IBD method does not trade indices, but rather individual stocks which meet their CANSLIM criteria. I believe their publications are filled with good ideas. The Follow Through Day may or may not be a good idea. It is the one I am quantifying in this series. So far it has disappointed.
Related Quantifiable Edges Studies