I received several notes on Friday from people that were curious about the Quantifiable Edges Capitualtive Breadth Indicator (CBI). The CBI actually closed at zero on Friday. Often when we see large selloffs there will be a spike in the CBI. The CBI is a count of all the active Catapult signals, which are tracked in the Quantifiable Edges Subscriber Letter. They basically look for a trend to be in place, and then a downward acceleration of that trend. So the CBI will typically spike when you have a good number of stocks experiencing prolonged selloffs. And that is most likely to occur while the SPX is also undergoing a sustained selloff. The chart below shows the CBI action over the last year.
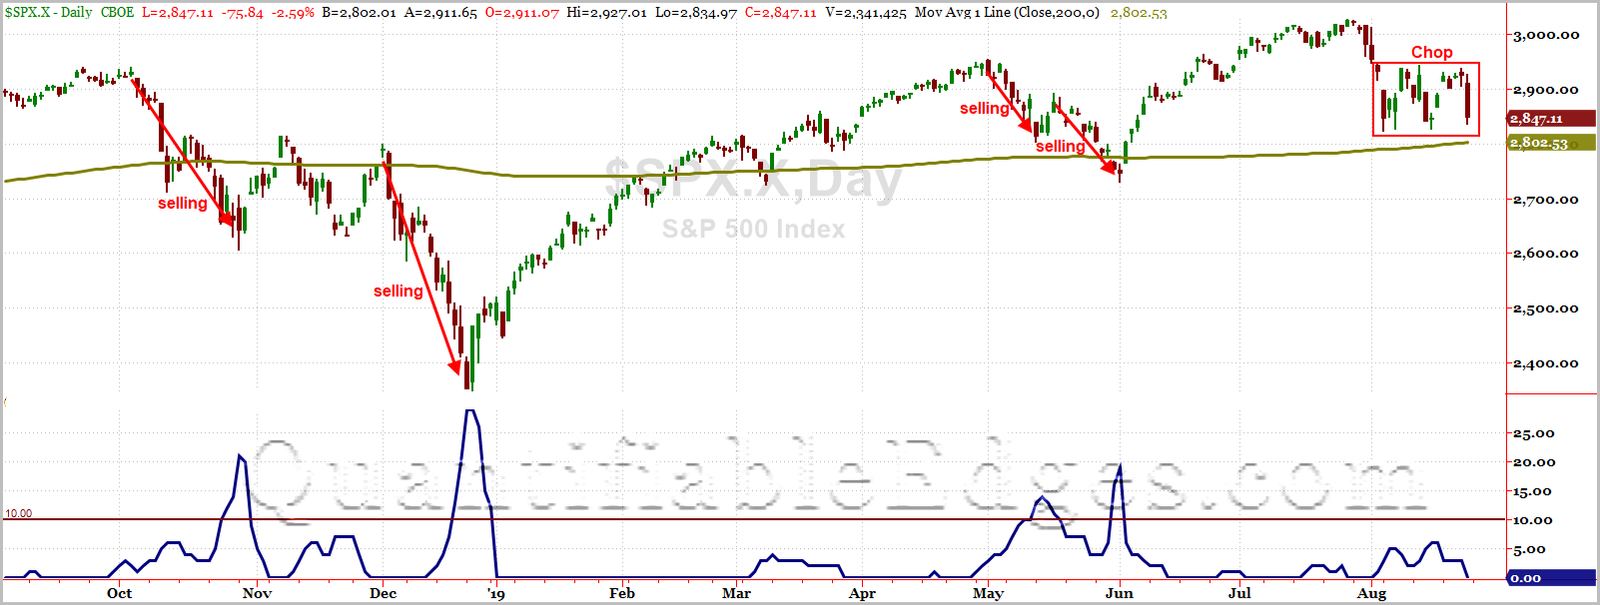
As you can see, the spikes occurred when the persistent selling became overdone. But the recent action is not persistent selling. It is exaggerated choppiness. So the CBI is dormant, and it will likely remain so unless we see a substantial breakdown.
Much more information is available on the CBI in the free CBI Research Paper.
Want research like this delivered directly to your inbox on a timely basis? Sign up for the Quantifiable Edges Email List.
Learn how to identify edges and formulate swing trading strategies in the new Quant Edges Swing Trading Course!