A few years ago I did a study of capitulative action – both among individual stocks as well as indices. From that I devised a system which I have now traded for close to 2.5 years. The most interesting aspect of this system is what I call my Capitulative Breadth Indicator. Without going into much detail the basic indicator looks to measure the breadth of capitulation among a select group of large cap stocks. The idea is that once enough of these stocks meet my criteria, not only they – but the market as a whole, is extremely likely to reverse sharply.
I’ve included a chart below which shows my indicator along with the S&P 500 over the course of 2007:
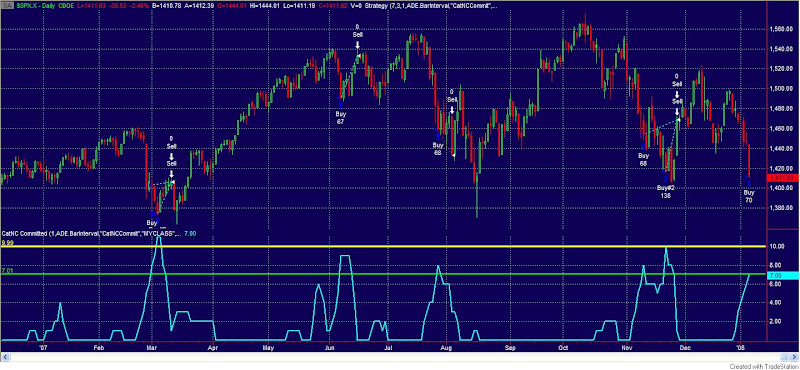
I generally use two levels to identify extreme capitulative breadth. The first level is a reading of “7” and the second is a reading of “10”. To show the significance of these levels I created a strategy which would buy the S&P whenever my indicator hit a stated level and then exit the trade when it returned to “3” or lower. This can be seen above with the buy and sell markings on the chart.
Below are some basic stats in a table from one of my presentations using different entry levels and “3” or below as the exit:

A few things should be noted:
1) The stats in the table are from 1/1/95 to present. I began trading in 9/2005. The rest is backtested.
2) The August action was extremely unusual in the fact that the indicator dropped rather sharply down to “3” on a day when the market also dropped sharply. This was due to a gap up that morning which served to reduce the indicator before the market collapsed. In actuality the August signal was actually good since the trade could have come off in the morning. The “system” results don’t reflect this.
3) The tool does an excellent job of alerting me to times when a strong bounce is likely. It only does an ok job of timing that bounce. In other words, the signals may frequently be early. See the November action on the chart for a good example of this. Nicely profitable trades that tested my nerves greatly before the exit came. For this reason I typically like to scale in to these kind of trades.
You’ll notice on the chart that the indicator hit “7” on Friday. This indicates a strong bounce is likely coming (but does not preclude further downside first).
I also use this indicator to look at individual groups and sectors. Based on what I am seeing there, it appears the groups with the best possibility of outperforming on the bounce are 1) Consumer and 2) Technology.
I will continue to update you on significant changes in the Capitulative Breadth Indicator (over 10, at or under 3, etc.).
I’ve posted a lot of stuff tonight. In summation: 1) The VXO is telling me we could bounce at any time, but until we do it’s gonna be ugly. 2) My Capitualtive Breadth Indicator is telling me the bounce should be fairly strong – probably at least strong enough to get back above where we are now. 3) My tiny watch list indicates to me that a strong bounce may not be enough to spark a rally. The upcoming bounce may be playable but don’t hang on too long – there may be further to drop afterwards.
Good trading,
Rob Hanna