I like to use the VIX (or VXO) as a tool for timing the market. When looking at the VXO I normally relate it to a short-term moving average rather than looking at absolute levels. Below is one test I ran this weekend that I found particularly interesting.
I looked to see what happened if you bought the S&P 500 under the following conditions:
1) The VXO closes at least 10% above its 10-day moving average for 3 days in a row.
2) The VXO closes at its highest high in the last 10 days.
In other words, fear has been relatively high over the last 3 days and is now at its highest recent point (if you accept that high option premium is indicative of fear among market participants).
$100,000 per trade. Results below:
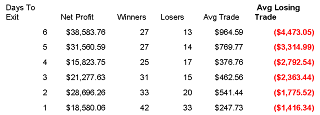
At first glance the results seemed to indicate a decent probability of a bounce and profitable system. Closer examination revealed something even more interesting to me. I’ve bolded the last column which shows the size of the average losing trade. When things go wrong – they go REALLY wrong. The average loss was nearly 4.5% in the S&P over the next 6 days!
Next I added a third condition to the test. I wanted to see what happened when the above circumstances occurred while the market was trading below it’s 200 days moving average (as it is now). Again $100,000 per trade. Even scarier Avg Loss column below:
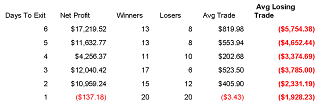
The probability of a bounce is now down to about 50-50 and the average loss is startling. Nearly 6% downside over the next 6 days for the losing trades!
My interpretation: there’s a good chance we could get a bounce here – but if we don’t…watch out!
Good trading,
Rob Hanna