Last week I looked at explosive moves off bottoms. Today’s was quite similar. I ran a test similar to last week to see how the market has acted under the following circumstances: 1) The S&P 500 made a 100-day low yesterday. (Last week I looked at closing lows. This week it was intraday lows.) 2) Today the S&P rose at least 3.5%.
I found 10 instances that met these criteria. 6 match last weeks test. Those are listed below along with my notes from last week.
5/27/70 – Shot higher for another 5 days in a row before resting.
7/12/74 – One more up day before 1 ½ day pullback followed by 1 week drift higher.
10/20/87 – One day higher then 3 day pullback before bouncing back up.
9/1/98 – 3 down days then next leg up.
9/24/01 – 1 more up day followed by 1 ½ day pullback then move higher.
5/8/02 – 2 day pullback of 3% followed by a 1-week rally that ultimately failed.
The four new ones are:
10/28/97 – 2 day pullback before next leg up
7/5/02 – A disaster of a an entry.
7/24/02 – Small 1-day pullback, then rocketed higher.
10/11/02 – 2 more days up before a small one day pullback and then further move higher.
The theme remains the same as last week. They have usually been followed by a pullback within the next 3 days and then a move higher.
I then decided to look at performance following any day the S&P 500 rose at least 4%. Results below: ($100,000 per trade)
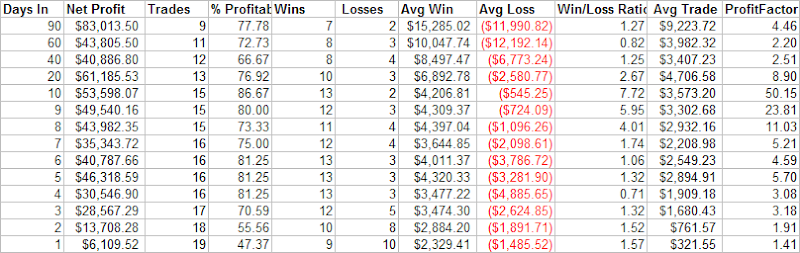
Looking out 2 weeks there appears to be a huge bullish edge. Thirteen of fifteen winners and an expected value of 3.6% over the period. Going out 90 days the average trade would have returned over 9%.
Looking at the table you’ll notice that the number of trades is reduced the further you look out. This is due to clustering of some trades. Clusters of days with strong percentage gains have been bullish in the past. I looked at all the times when the S&P had two days where it gained 3.5% in a two-week period. Seven instances were found. They were: 10/9/74, 8/20/82, 10/21/87, 9/8/98, 4/18/01, 7/29/02, and 10/11/02. Some important turning points among that list. Below is a table summarizing the returns: ($100,000 per trade)
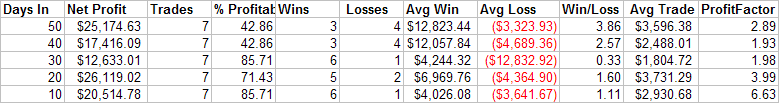
The strongest edge appears in the month following the cluster.
Also of note is the fact that breadth was extremely positive today. Upside volume swamped downside by more than 9:1. Last week we just missed a 90% upside day, posting 89%. While it doesn’t quite fit the criteria, I did a study in November on my old blog looking at 2 90% upside volume days within a 5-day period. Results were extremely bullish, although that instance did not work out well.
In all, I’d have to say that today’s action was very bullish. Combining it with last weeks and taking into consideration such things as put/call ratios, VIX levels, etc and I’d say there is a good chance the next month or so will lead to higher prices. Will it turn into a strong bear-market rally that eventually rolls over? Don’t know. Don’t really care. What I see in front of me is quite bullish over the next several weeks. Buying pullbacks could work very well. As I discussed above, we’ll probably see lower prices at some point in the next week. Last night’s Fed study also suggested a pullback in the coming days is likely. Therefore, chasing this is likely not necessary. I’ll be ready to add to my positions if it does pull back.