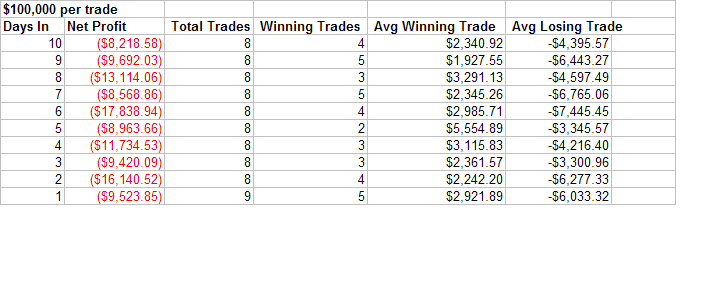
Signs are finally showing that the market is beginning to capitualte, at least on a short-term basis. Thursday saw another day where down volume swamped up volume on the NYSE by more than 9:1. Volume spiked. The price drop was over 2.5% in the major indices. The VIX has finally begun to spike. We seem to be in the midst of a waterfall decline. I ran several tests last night looking for indications that a bounce was immenent. I was dissapointed. Below is one example:
S&P 500 hits 50-day low on the largest decline in 50 days and largest volume in 50 days. Breadth is at least 9:1 negative. Hold X days:
The instances found are as follows:
10/16/87 (and 10/19/87), 10/13/89, 10/27/97, 8/4/98, 8/27/98, 5/17/06, 2/27/07, and 7/26/07.
Some pretty scary selloffs among that bunch. I’d suggest traders review their charts to see those dates. As stretched as the market is, and with breadth, volume, and sentiment indicators all spiking a bounce is surely coming soon. Stepping in too early could make for some hairy trading, though. My Capitualtive Breadth Indicator has only reached “3” at this point. While it doesn’t capture every spike lower, I’d be more comfortable getting aggressive if it was at “7” or higher. Nibbling may be ok, but my studies suggest caution is warranted. As I write this in the morning the futures are already bouncing over 1.5%- making for a difficult entry for traders even looking to nibble.
Regards,
Rob

