The market finally decided it had endured enough selling and put in a strong afternoon reversal. The bar looks nice on a chart, but is it indicative of a longer-term reversal? To test it I ran the following quantitative study (as usual each trade is $100,000):
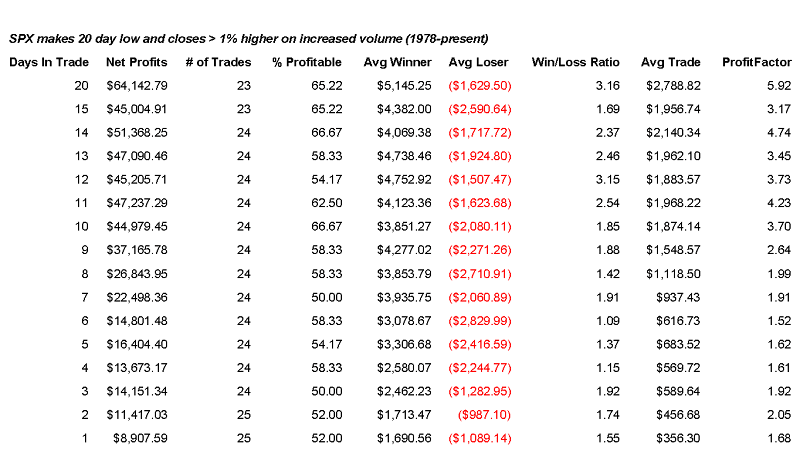
Over the first 1-7 days, it appears to be a toss-up, but as you look a little bit further out there appears to be a solid edge to the upside. One reason the edge appears to be lower in the first few days is that the market has just made a large move up. Frequently this initial thrust takes a few days to digest (more on that lower down).
What I find especially compelling about this scenario are the size of the average winners – especially when compared to the average loser. If the reversal bar works, the expectation is for somewhere around a 4-5% follow through in the next 2-4 weeks based on these results. Note the win/loss ratios and profit factors once you get out more than 10 days. They’re quite good.
For a more detailed look I evaluated the results 14 days out. That would put us at the end of the month and the next Fed meeting. Obviously no one will be worried about this backtest when the Fed is about to announce.
Fourteen days out 16 of 24 trades were winners. Of those sixteen winners, all of them pulled back at least 0.5% from the reversal day close at some point. The average drawdown among those 16 winners was 2.6%. The largest drawdown among winning trades was 6.6% which occurred after the reversal bar last August 6th. Five of the sixteen winners actually posted a lower low before turning higher again. In other words, it’s probably not neccessary to chase this trade. There will most likely be some backing and filling which should allow for a better entry point or some scaling in.
This one gets stamped “quantifiable edge”.