A Compelling 3-day Pullback Study

Tuesday marked the 3rd close lower in a row for SPY.  Three-day pullbacks will often trigger a few bullish studies.  The one below is the one I found most interesting.  It was featured in last night’s subscriber letter.  It looked at other times that SPY had a 3-day pullback from a 50-day high, and that pullback was deep enough to put it below the 10ma, but not deep enough to see it at a 10-day closing low.  I have updated the stats table below.

 
Under these circumstances, it appears bounces have been both reliable and powerful.

A Long Term Look At Thanksgiving Wednesday

Thanksgiving has shown some pretty consistent seasonality over the years.  On Monday I showed a table breaking returns down by day of the week.  Both the Wednesday before and the Friday after have exhibited bullish tendencies while the Monday after has been somewhat bearish.  Today I decided to show a profit curve that represents simply owning the SPX from Tuesday’s close through Wednesday’s close.

Appears to be an impressive looking upslope.  Happy Thanksgiving!

An Updated Look At Thanksgiving Week Tendencies

Historically Thanksgiving week has shown some very strong tendencies. The last time I showed the table below on the blog was in 2010.  I decided to update it this year.

Monday and Tuesday before Thanksgiving don’t seem to carry a sizable edge. Monday’s total return was actually negative until 2008 when it posted a gain of over 6%. Wednesday and Friday surrounding Thanksgiving have shown strong upside tendencies and the Monday after has shown a downside edge.

Back to Back Outside Days for QQQ

QQQ made both a lower low and a higher high on Wednesday versus the day before.  That is often referred to as an “outside day”.  Outside days are not terribly unusual.  What is unusual is that it happened fort eh 2nd day in a row.  In the past the simple fact that range has expanded for the last 2 days has led to a short-term rally.  I last showed this in the 8/22/12 blog.  Below is an updated results table.

The numbers all appear impressive.  I also produced an equity curve that assumed a 1-day holding period.

The persistent upslope is impressive and it serves to confirm the upside edge.

The TICK TomOscillator & How It Is Suggesting A Bounce

This morning @PsychTrader was kind enough to mention Quantifiable Edges and the TICK TomOscillator on StockTwits.

The blog post he linked to was this one from May 13, 2011.

In light of this I thought I would share the study that was discussed in the subscriber letter last night that @PsychTrader referred to as the long signal.  It utilized the standard TICK TomOscillator (as Tom McClellan designed it).  The standard reading was -245.42 at the close yesterday.  This is extremely low.  In fact, there have only been 3 lower readings in the past year.  The study looked at readings below -200 that coincided with a 5-day low in in SPX and an SPX close above its 200-day moving average.  Here is the results table:

 There has been a strong propensity for the market to bounce over the next 2-3 days.  Despite the negative reaction to the jobs report, traders may want to keep this in mind.

SPY Registers 1st 5-day Low In A While – Now What?

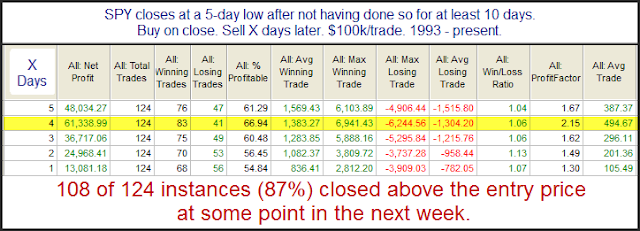
Thursday the SPY managed to close at a 5-day low after 16 days without doing so.  This triggered the study below, which I last showed on the blog May 25th.

Results here suggest a moderate upside edge.  As I have said before, persistent uptrends normally wither before they die. They rarely just turn on a dime.  It appears unlikely that SPY will be faced with a lot more selling before it manages to bounce.

Fed Days And Intermediate-Term Highs

Tomorrow is a Fed Day. As I have discussed many times, Fed Days generally carry an upside tendency. But this tendency is greatly impacted by certain variables. A large collection of these variables may be found here on the blog under the “Fed Day”label. And many more may be found in the “Quantifiable Edges Guide to Fed Days”.

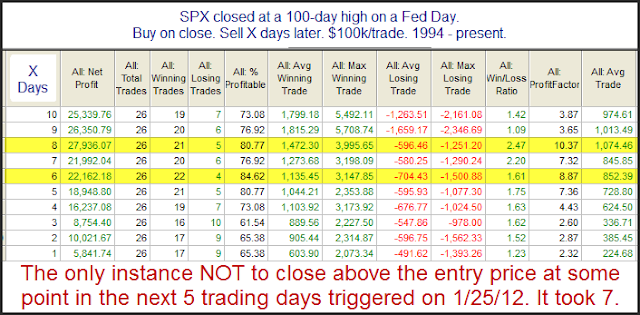
One variable I showed about a year ago was whether the market was already at an intermediate-term high. There is a decent chance the market closes at a new high today so I’ve decided to update that study.

First, let’s take a look at SPX performance on Fed Days when the SPX has NOT closed at a 20-day high the day before.


That’s nearly 32  years of bullishness.

But now let’s see performance at times when the SPX did close at a 20-day high the day before.


No consistency and no pronounced edge in this sample of 41 instances.

Traders looking to play for a short-term Fed Day bump should perhaps be hoping the SPX does not close at a new high today.

Also, for related research with regards to the overnight,  be sure to check out this post at OvernightEdges.

SPY Extended To The Point That Often Leads To A Pullback

SPY has now gone 12 days without closing below its 5ma. The study below is one I’ve shown a few times over the years.  It looks at other instances in which SPY has traded above the 5ma for at least 2 weeks and is now closing at a 10-day high. All results are updated.
 

In the past this setup has commonly been followed by a short-term pullback. The downside edge doesn’t last long, though. It seems to pretty much play itself out over the first 2 days.  It is not an overwhelming edge, but it is still worth noting that SPY has been short-term extended for a while and the normal course of action at this point is a little pullback.

What’s Going to Happen in Vegas

The International Traders Expo is going to be at Caesar’s Palace from November 20-23, 2013.

I’ve been to this expo a few other times and have really enjoyed it.  I’m pleased to announce I’ll be back this year and giving a presentation on Friday, November 22 at 2pm.

The topic of my presentation will be “Quantifiable Edges for Short-Term Trading”.  I’ll be covering a lot of my favorite studies and setups.

I hope to get the opportunity to meet many readers and subscribers at the Expo.

Another VIX Study With A Short-Term Warning

The VIX most often will trade opposite SPX.  But Tuesday it rose along with it.  That’s not too unusual for one day, but the same thing also happened Monday.  This triggered the study below which was last seen in the 5/16/13 subscriber letter.  I discussed the results in some detail in last night’s letter, and have shown the profit curve below assuming a 1-day holding period.

Overall the results appear to suggest a moderate downside edge for Wednesday.

Uh-Oh, Low VXO (Revisted)

Both the VIX and VXO (which is the old calculation for the VIX) closed well below their 10-day average for the 3rd day in a row on Friday.  This action in VXO triggered a study that I last discussed here on the blog on January 7, 2013.  The January instance followed the fiscal cliff deal at the end of last year, which was similar to the recent shutdown/debt ceiling debate. The study looks for stretches of 15% or more below the 10ma that have persisted for three days.

Based on the stats table there appears to be a downside inclination. I find the note at the bottom of the study to be especially interesting. Nearly every case has experienced an almost immediate pullback, but those that didn’t went without pulling back for a long time.

SPY Results After Days Like Monday With Strong Gap Reversals To 10-Day Highs

Many traders view reversals like Monday as a positive.  The fact that the market overcame a gap down and was able to close in the black and near its highs is interpreted as a sign of strength.  I’ve looked at days similar to this in the past and found that most often they are actually followed by short-term market weakness.  Below is a study that looks at situations like Monday’s.  It assumes a 1-day hold.

Eleven of 15 instances have closed down the next day.  Of course that is a bit of a small sample size, and another concern is the fact that it has been over 4 years since the last instance.  Still, I think the study is worth some consideration.

An Updated Look At A Columbus Day Edge

While the stock market is open on Monday, banks, schools, and the bond market are closed.  (Government offices, too, but they are closed all the time these days.)  In past years with the bond market closed, the stock market has done quite well on Columbus Day.  Of course the most famous Columbus Day rally was in 2008 when the market gained over 11% after having crashed the week before.  The last few years I showed that positive momentum leading up to Columbus Day has generally led to a positive Columbus Day.  Columbus Day has been celebrated on the 2nd Monday of October since 1971.  Below is an updated version of the Columbus Day study.


I’ve circled some of the more impressive stats here.  With 74% of trades profitable and winners twice the size of losers, risk/reward has been very favorable.  The note below the stats table is also worth considering, and with big overnight drop in the futures could come into play once again.

VIX Spikes To New Highs

It is notable that the VIX spiked up 16% on Monday and closed at the highest level since June.  In the past when it has closed at a high level on a strong move there has been a tendency for the SPX to bounce over the next few days. This can be seen in the study below from the 5/15/12 blog.  (Stats are updated.)

The numbers appear compelling. Below is a profit curve using a 2-day hold.

This study has been persistently bullish for a long time and certainly appears worth consideration.

Big Gaps Down on Mondays

I took a look this morning to see how the market has typically reacted when faced with a big gap down on a Monday morning.  Results below examine all gaps of 0.75% or more and measure the performance from the 9:30 open to the 4pm close.

Numbers here look a bit poor.  I also ran a profit curve.
The curve shows that the downside edge appears to have lessened over time.  I also decided to break it down by the long-term trend.  These next 2 charts show results when below and then above the 200ma.

It appears the real damage has been done during long-term downtrends.  During uptrends, big gaps down on Monday’s have been neither reliably bullish nor reliably bearish.  Additional evidence would be needed for me to initiate a new position.