Updating Intraday Holy Thursday Returns

In the past I have shown that the Thursday before Easter (also known as Holy Thursday) has exhibited a bullish inclination over the years. Last year I broke out that performance by overnight vs. intraday returns. I have updated that research today.  Intraday returns will be shown here. Overnight returns can be found on Overnight Edges.

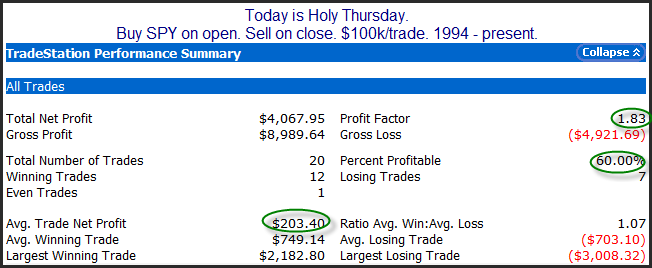
The study below shows historical performance from open to close on Holy Thursday.

2014-04-16 image1

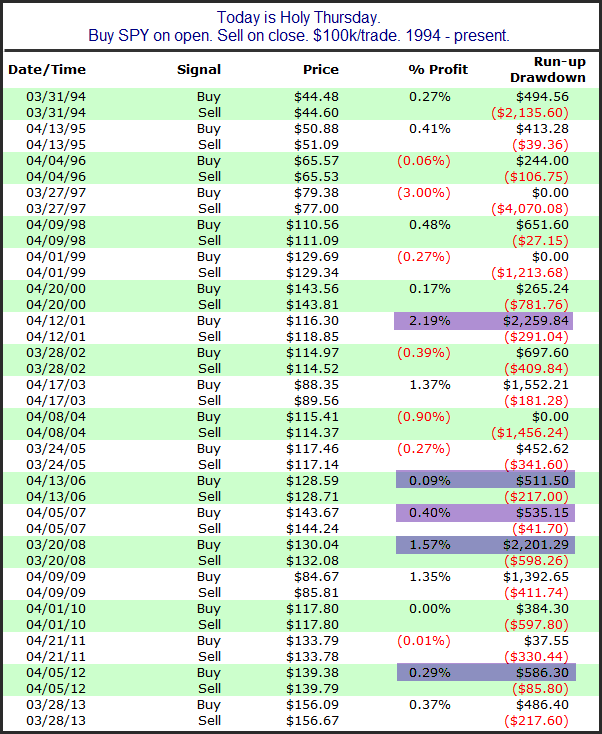
Numbers here appear solidly bullish. Below is the list of instances.

2014-04-16-2 image1

Instances highlighted in purple are the 5 that started with a gap down. All 5 of these gaps were filled at one point during the day, and all 5 instances saw SPY close above where it opened (with 2 of them making for the largest 2 gains of the 20 listed).

There are numerous ways to try and take advantage of this information. In general, traders should be aware that Holy Thursday has exhibited seasonal strength, and that strength has often begun to exert itself the night before. For a more detailed breakdown of the overnight returns, check out today’s Overnight Edges blog post.


Want research like this delivered directly to your inbox on a timely basis? Sign up for the Quantifiable Edges Email List.

Happy Tax Day! (Again)

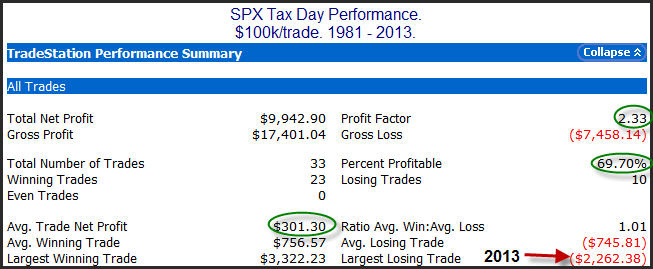
Today is the day taxes are due in the U.S. The reason tax day may be important is that it is the last day that people can make IRA contributions to count for the previous tax year. This can create a last-minute rush and you will often have an inflow of funds heading into the market right around and on April 15th. Fund managers will often put this money to work immediately and it creates a positive bias for the market. Tax Day itself seems to have benefited over the years. I showed this on the blog last year.  Below I have updated the statistics.

2014-04-15 image1

I will note that last year certainly did not fall in line, as it produced the worst loss of the sample. But the overall numbers still appear impressive.


Want research like this delivered directly to your inbox on a timely basis? Sign up for the Quantifiable Edges Email List.

What’s Historically Followed Strong Selloffs Like Thursday’s

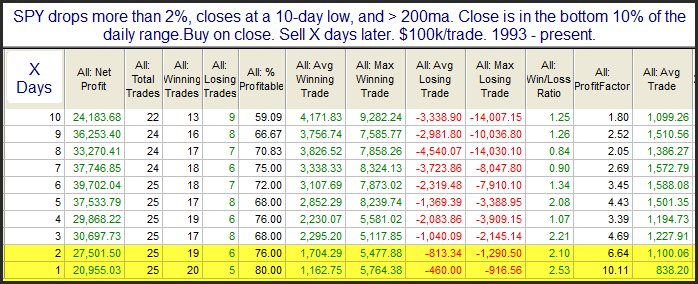
Strong selloffs to low levels during long-term uptrends often generate favorable buying opportunities. Quantifiable Edges had a number of studies that triggered on Thursday afternoon that exemplified this concept. Below is just one example. It examines 2% drops that close at both the bottom of their daily range and their 10-day range.

2014-04-11 image1

The 1-2 days results here are especially intriguing. They suggest a good chance of a bounce.


Want research like this delivered directly to your inbox on a timely basis? Sign up for the Quantifiable Edges Email List.

SPX New High On A Day NDX Sells Off Strongly

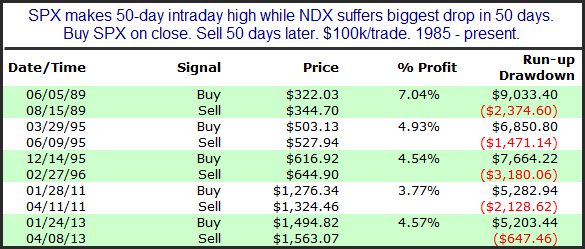
The new all=time intraday high Friday for SPX came on a day when NDX had its worst day in over a year. There has never been another time where SPX made a 200-day intraday high while NDX had its worst drop of the last 200 days. Loosening the criteria to a 50-day high for SPX and the biggest drop in 50-days for NDX there have been 5 instances.

2014-04-07 image1

Too few occurrences to put much confidence in an edge, but the limited results are fairly impressive. I note that every instance had a run-up of at least 5%, and the largest drawdown was under 3.2%.


Want research like this delivered directly to your inbox on a timely basis? Sign up for the Quantifiable Edges Email List.

Quantifiable Edges for Short-Term Trading – Free Webinar Tuesday As Part of the Festival of Traders!

I’m going to be participating in The Festival of Traders this month.  It is a 2-day event that features webinar presentations from 8 traders.

I’ll be speaking about short-term trading.  My talk is scheduled for 4:45pm EST on Tuesday, April 8th.  Time not convenient?  No worries! Register using this link and recordings of all speakers will be automatically sent to you at the conclusion of the Festival.

And beyond my talk, the line-up looks very impressive.  In fact, 2 of the 7 guys I placed on my list of “Real Deal Traders” will be talking – Scott Andrews and Dave Landry.

This is a Quantifiable Edge I suggest you take advantage of!

Again, the link to register is available here.  (Nothing but an email address required.)

Putting the Current Intraday Employment Hot Streak Into Perspective

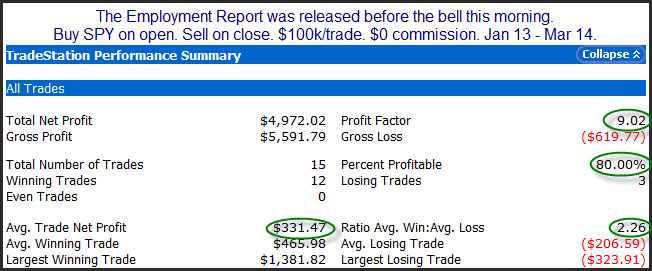
It looks like the jobs report this morning is getting a positive reaction, and unless there is a sizable turnaround before the open, it will again lead to a gap higher. Last month I showed how SPY had done on Employment Days between the 9:30am open and the 4pm NYSE close. I’ve updated that study below.

2014-04-04 image1

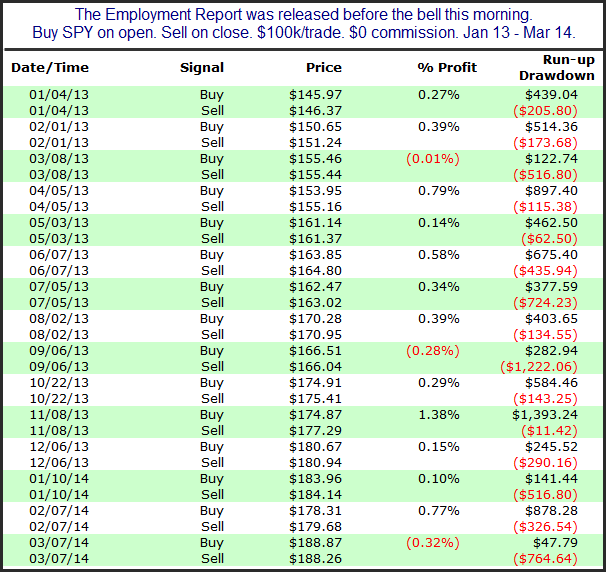
Since the beginning of 2013 the intraday performance has been quite strong. Let’s take a look at the individual instances.

2014-04-04 image2

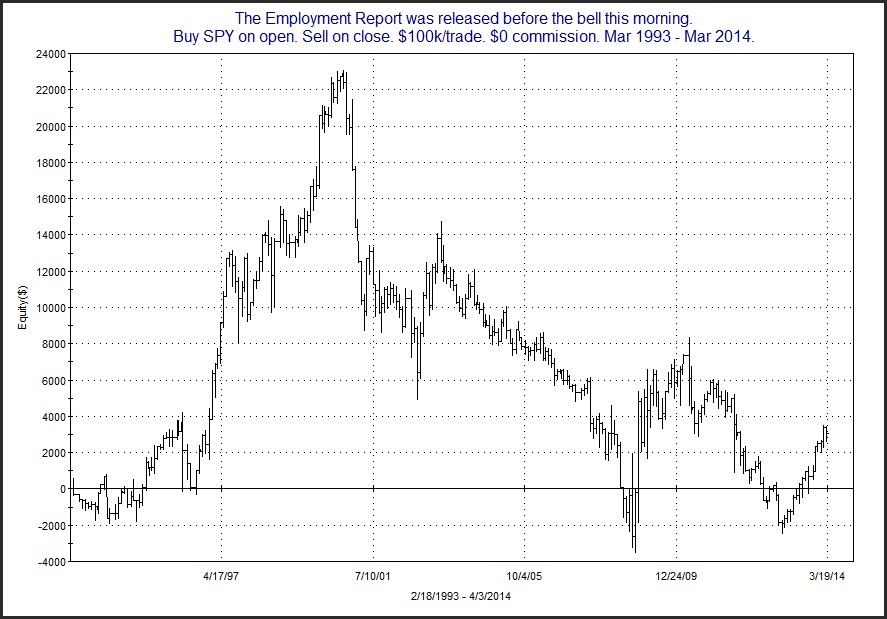
Last month was the biggest loser of the bunch. (Though with the big gap up last month SPY did still close above the previous day’s close.) Overall, it appears the recent tendency has been for the market to post gains throughout the day. I will note, though, that while this has been the trend since the beginning of 2013, it has not been the long-term bias of the market. There have been hot and cold streaks throughout history. For those that want to put the current hot-streak in a long-term perspective, here is a chart going back to 1993.

2014-04-04 image3

So the hot streak appears notable – but not completely reliable.


Want research like this delivered directly to your inbox on a timely basis? Sign up for the Quantifiable Edges Email List.

Early April’s Strong Bullish Tendency

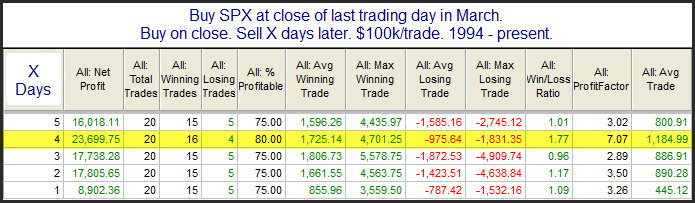
Early April has been a strong period for the market over the years. The study below looks at the last 20.

2014-03-31 image1

Numbers here appear impressive. I should note though, that 2 of the losers for the 4-day holding period came in 2012 and 2013. It’s too early to say that the edge is no longer prevalent. I’m still giving this one the benefit of the doubt, but we’ll need to keep watch over the next few years to see if this last two years was just a blip, or whether the tendency is really changing.


Want research like this delivered directly to your inbox on a timely basis? Sign up for the Quantifiable Edges Email List.

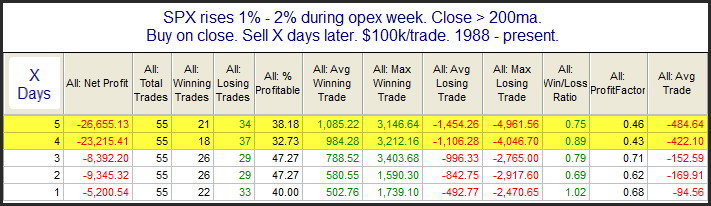
What Follows Solid Gains During OpEx Week

Strong moves on most opex weeks will often be followed by a pullback the following week. This can be seen in the study below, which I have shown a number of times over the years in the Subscriber Letter.

2014-03-24 image1

The stats suggest a short-term downside edge. Four days out the SPX has closed lower more than 2/3 of the time, and the losers have been a little larger than the winners on average. Traders may want to remain aware of the strong possibility of a pullback this week.


Want research like this delivered directly to your inbox on a timely basis? Sign up for the Quantifiable Edges Email List.

Where SPX Would Be Without The Fed

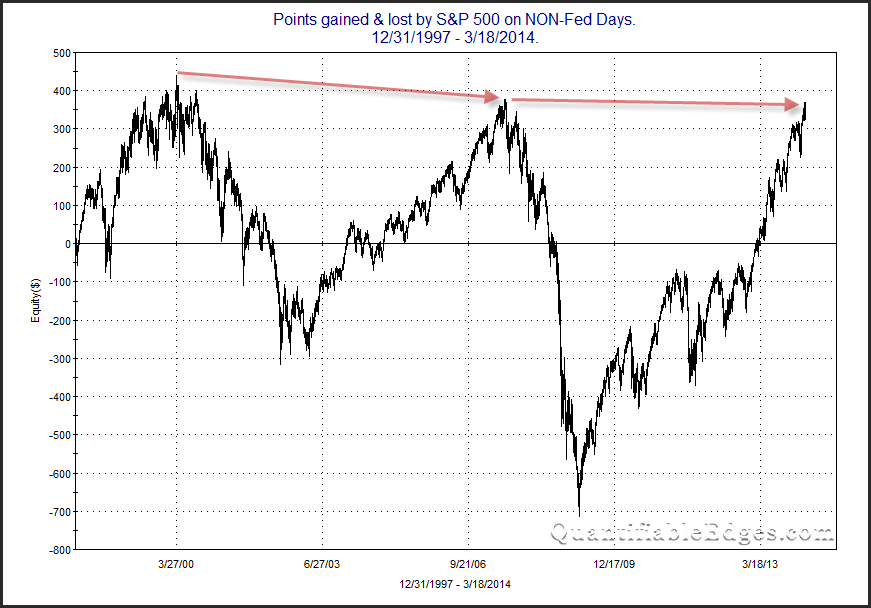
I have shown how powerful Fed Days have been a number of different ways over the years. Ever wonder where the market would be without them? The chart below shows the daily points gained and lost on every day since 12/31/97 through 3/18/14, excluding Fed Days. Keep in mind, there are only 8 days per year being left out.

2014-03-19 image2

As you can see, without Fed Days the SPX would still be about 15 points below the 2007 high, and close to 50 points below the 2000 high!

Thanks Fed!


Want research like this delivered directly to your inbox on a timely basis? Sign up for the Quantifiable Edges Email List.

Implications of Two Days of Very Weak Volume

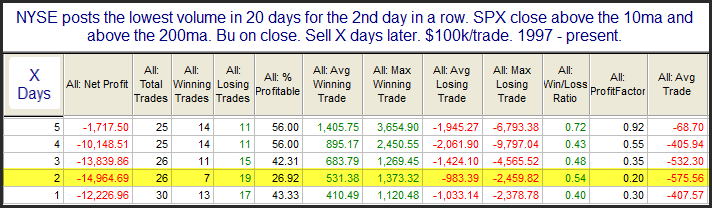
One notable about Tuesday’s rally is that it marked the lowest volume in over a month for the second day in a row. The Quantifinder identified a study I did about 3 years ago that looked at low-volume setups like this when SPX closed above both the 10-day and 200-day moving averages. I went back and took another look last night. Below is an updated results table.

2014-03-19 image1

The numbers appear to suggest a downside edge over the first couple of days. Of course results for today and tomorrow will be heavily influenced by the market’s reaction to today’s Fed announcement.

Fed Days have long carried a strong upside bias. But when the market is already near an intermediate-term high this upside bias has not been as prevalent.

I am certainly seeing some crosswinds at the moment. The volume-related study above appears to be a negative, and while it is not the only factor ruling the market at the moment, it seems worth some consideration.


Want research like this delivered directly to your inbox on a timely basis? Sign up for the Quantifiable Edges Email List.

Strong Breadth on Days the SPX Declines

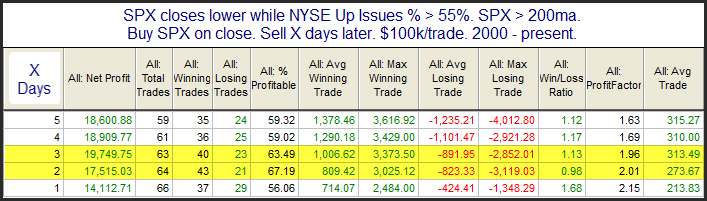
With small-caps doing well on Friday but large-caps struggling the Up Issues % was unusually strong for a day that the SPX declined. The study below is from the Quantifinder and it looks at days like Friday where SPX declined despite strong breadth.

2014-03-16 image1

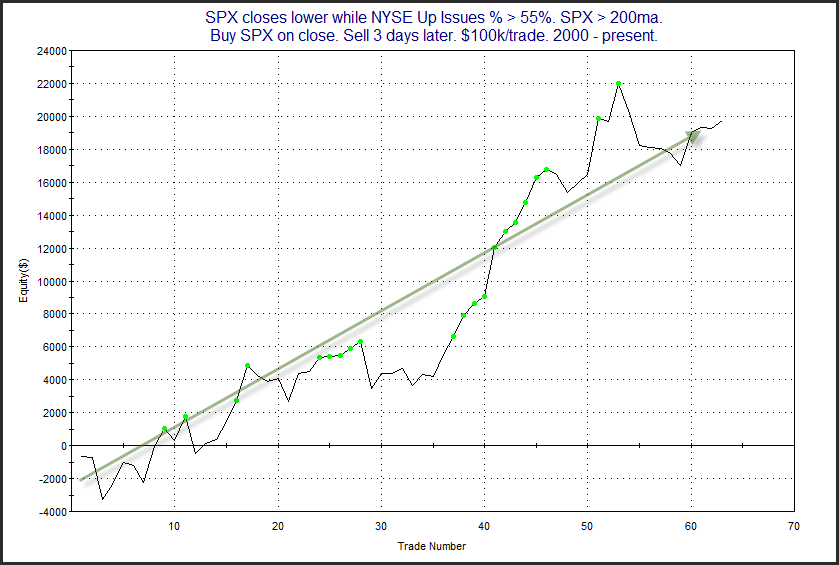
The edge isn’t huge, but it does appear to be worth a closer look. The profit curve below gives a better idea of how it has played out over time.

2014-03-16 image2

While the curve certainly appears choppy, it has persisted upwards. I believe this study is worth taking into consideration when determining my market bias.


Want research like this delivered directly to your inbox on a timely basis? Sign up for the Quantifiable Edges Email List.

What The Gap & Reverse Pattern Of The Last Two Days Is Suggesting

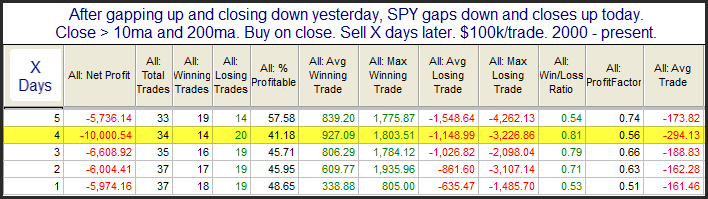
The way SPY has gapped and reversed the last couple of days triggered an interesting study in the Quantifinder. An updated version of that study is below.

2014-03-13 image1

It appears the choppy conditions may continue and the next chop is a little more likely to take the market lower. The edge isn’t huge but risk/reward has seemed to favor the bears.


Want research like this delivered directly to your inbox on a timely basis? Sign up for the Quantifiable Edges Email List.

When SPY Makes A Short-Term Low For The 1st Time In A Long Time

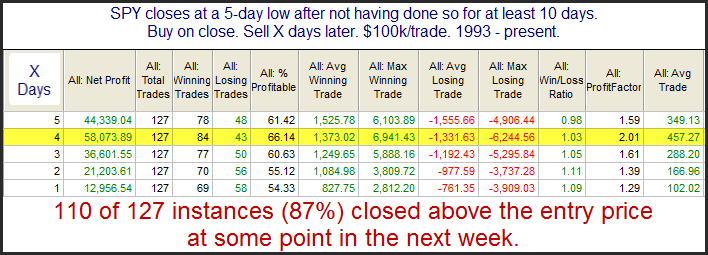
Tuesday SPY managed to close at a 5-day low after going a whopping 24 days without doing so. The study below is one I have shown in the past. It examines times when  SPY closed at a 5-day low for the 1st time in over 2 weeks. All stats are updated.

2014-03-12 image1

Results here suggest a moderate upside edge.  I will also note that I looked at longer periods (15 days, 20 days) without a new low, and the 4-day results were very similar to those shown above. The lesson with this study seems to be that persistent uptrends normally wither before they die, rather than turn on a dime.


Want research like this delivered directly to your inbox on a timely basis? Sign up for the Quantifiable Edges Email List.

Double Outside Days

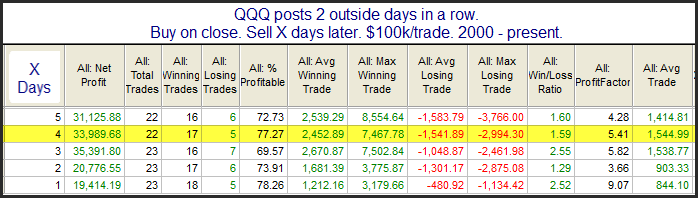
QQQ made both a lower low and a higher high on Friday versus the day before. That is often referred to as an “outside day”. Outside days are not terribly unusual. What is unusual is that it happened for the 2nd day in a row. In the past I have shown that double outside day patterns like this have frequently been followed by short-term rallies. I last discussed this in the 11/14/13 blog. Below is an updated results table.

2014-03-10 image1

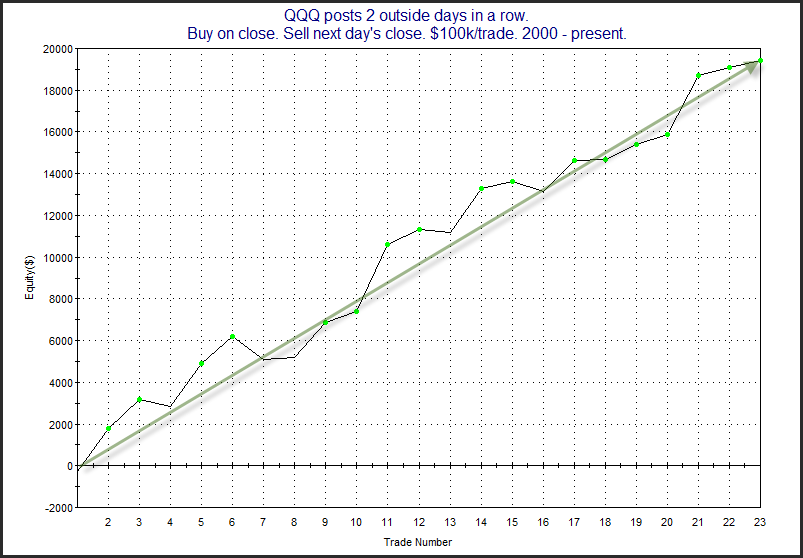
Results here appear quite positive. Using the 1-day exit criteria, I generated the profit curve below.

2014-03-10 image2

The strong, persistent upslope here is impressive.

It’s also worth noting that this pattern has also been bullish for SPY.


Want research like this delivered directly to your inbox on a timely basis? Sign up for the Quantifiable Edges Email List.

The Employment Report Intraday Hot Streak

At Overnight Edges today I published a study that showed the incredible hot streak the market has been on during nights when the Employment Report was released. It got me to thinking…I know the market has done well leading up to the open, how has it done after the open? The answer is below.

2014-03-06 image1

The numbers here were surprisingly good. I would have thought there would have been some give back after some of those gaps up. But the market has continued to add to its gains (or recover from overnight losses) in almost every instance. Below are all the instances since the beginning of 2013.

2014-03-06 image2

Instances here look no less impressive than the summary stats above. The only instance that lost more than $0.02 was the one on 9/6/13. Intraday traders may want to keep this bullish tendency in mind as they navigate their day on Friday.

Of course if you put these 2 studies together, and look at Thursday’s close to Friday’s close, then the numbers are even more astounding. The only loser under that scenario would have been the 4/5/13 instance which saw strong intraday gains, but could not fight its way all the way back from the massive gap down it endured.

No matter how you look at it, Employment Days have been hot, and traders should be aware of that fact when considering their strategies.


Want research like this delivered directly to your inbox on a timely basis? Sign up for the Quantifiable Edges Email List.