A Big SPY Up Day Follow By A Low-Volume Tight Range Has Often Led To Trouble

Big intraday rallies like we saw on Wednesday that have been followed by tight, low volume consolidations like Thursday have often seen the market roll over.  The study below looks at this setup.  I last discussed it in in the 8/11/09 Subscriber Letter.  The parameters have only been met 10 previous times by SPY.  I have listed them all along with their 5-day returns below.

Instances are low but the inclination so far is strongly bearish.  The last 7 occurences closed lower 5 days later, and all by at least 1.3%.  Additionally, the Avg Drawdown is nearly 3x the Average Run-up.  Even with the low number of instances, I think this study is worth some consideration.

7 Real Deal Traders With Quality Services

Labor Day according to Wikipedia is a holiday “dedicated to the social and economic achievements of workers”.  So I was thinking this past weekend about some of the hardest working traders I know.  People that not only trade for a living, but as I do, offer products designed to help traders find their way.  I made a list of “Real Deal” guys.  To qualify for the list you need to meet some very specific, rigid, and somewhat unfair criteria.

1) You must actually be a trader (and make money doing it).
2) You must have a product that I am familiar with and I truly think is valuable to others.
3) I am able to verify 1 & 2 through personally knowing the person.  This means we have either met in person, or at a bare minimum, have had several long phone conversations over an extended period of time.  If I don’t know you, you aren’t on this list (that’s the unfair part).
4) You are not part of a large organization.  I started writing this with Labor Day in mind.  I know how hard it is to run a small operation and have to wear so many hats.  Everyone on the list is similar in that they are either solo or have at most a handful of people working with them.

So these are all people I feel I know to some degree and who I believe have something valuable to offer.  I also think they are upstanding folks who I am comfortable recommending.  Of course I think Quantifiable Edges & Overnight Edges are the greatest services out there, but they don’t match everyone’s style, and they don’t cover everything.  So here are some other Real Deals to check out (in alphabetical order).

Scott Andrews (www.masterthegap.com) – “The Gap Guy”.  Scott’s quantitative testing is similar to mine, but is focused on gap fading, and some intraday breakout analysis.  I think he provides solid information for daytraders, I like his style, and he has become a friend over the years.

Charles Kirk(https://www.kirkreport.com/)  – At $100/year a Kirk Report subscription should be a no-brainer for nearly every trader.  His screens, analysis, links, and experience make this a resource well worth checking out.  The Kirk Report turned 10-years old this week, showing that this “real deal” (and all-around good guy) has had some staying power.

Dave Landry (https://www.davelandry.com/)– Dave’s been around a long time.  I’ve always liked his work and his ability to keep things simple.  Dave’s sense of humor always seems to shine through as well.  He’s tough not to like.

Bill Luby (https://vixandmore.blogspot.com/) – VIX & More is a terrific blog.  And traders with an eye on volatility should check out Bill’s subscription products as well.  He is an incredible resource and a real authority on volatility and ways to take advantage of it.  When it comes to the VIX, Bill is THE real deal.

Tom McClellan (https://www.mcoscillator.com/) – Tom is one of the most interesting analysts I know.  His liquidity wave approach and price pattern analogs never cease to grab my attention.  I’ve also incorporated some of his work & ideas into Quantifiable Edges (such as the TICK TomOscillator).  His knowledge also goes far beyond stocks.  I’ve met Tom a number of times, and have learned something new about science or history every time.

Jeff Pietsch (https://etfprophet.com/etf-rewind-pro/)– Jeff does not blog as much anymore, but his ETF Rewind product is a great tool for ETF traders.  It puts the ETF universe in a neat, sortable, format and makes it easier for traders to find opportunities based on a number of technical criteria.

Corey Rosenbloom (https://www.afraidtotrade.com/) – The last hard worker on this alphabetical list is also the youngest of the group.  But he does not lack for wisdom (or enthusiasm for his own work).  Corey takes a solid approach to daytrading and is certainly worth checking out.

That’s it.  Seven Real Deal people whose work I admire.  Check ‘em out when you get a chance.

Oh yeah.  Might as well plug myself as well.  Check out a subscription to Quantifiable Edges (free) or Overnight Edges ($5) sometime if you haven’t before.

An Updated Look At The Friday Before Labor Day

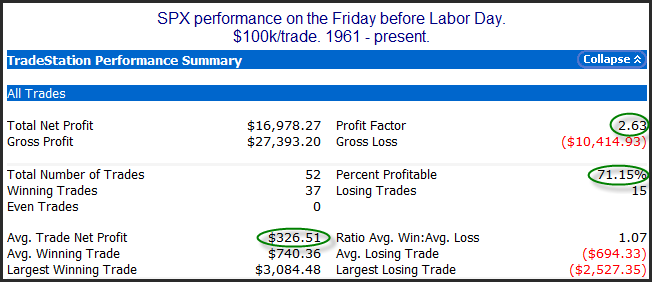
The Friday before Labor Day has long been a strong seasonal day for the market.  The study below is one I also showed last year.  The stats table based on buying the Thursday before Labor Day and selling the close on Friday.

With 71% of the days finishing higher, a profit factor of over 2.5, and an average trade of 0.3% the stats are quite compelling.  Regardless how it plays out today, I hope everyone has a great Labor Day weekend!

A Look At Recent 1% Gap Down Days

SPY is looking like it could open down over 1% this morning.  While a 1% gap may have been considered small in the fall of 2008, this would be only the 3rd time this year that SPY gapped down as much as 1%.  Below I have listed all 1% gap downs since the beginning of 2012, and how they fared from open to close.

More often than not they have gained back some losses during the day, but it certainly has not been a lock.  Good luck trading today.

3 Lower Highs, Lows, & Closes Going Into Tuesday

At Overnight Edges yesterday I noted that there was a strong bullish overnight edge when ES had made at least three consecutive lower highs, lows, and closes. I’ve also discussed in the past that Tuesdays are known for their turnaround capabilities. The study below uses SPY and it looks at swing-term implications of the 3+ days of lower highs, lower lows, and lower closes when today is Monday.

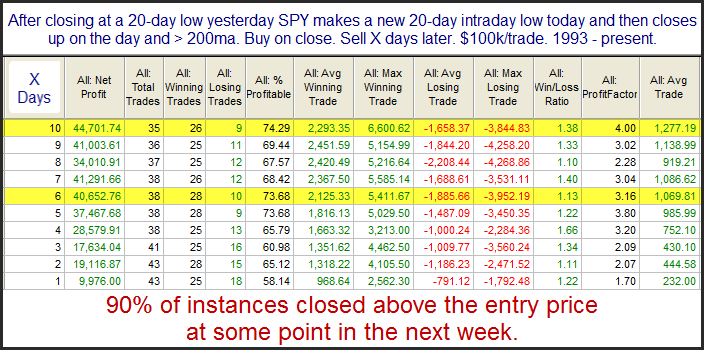
As you can see the numbers are very strong.  Not seen in the above table is the fact that 33 of the 34 instances closed above the entry price at some point in the next 4 days.  This all points to a strong likelihood of a bounce.

What Thursday’s Unfilled Gap Down & Poor Close Suggest For The Next 2 Weeks

The study below is one that I have shown before, but not for a while.  It looks at days like Thursday where SPY posts an unfilled gap down that closes poorly while the market is in a short-term downtrend, but a long-term uptrend. Results are updated.

Results are strong right from the start and look good throughout the first two weeks.  This one favors the bulls.

No Turnaround Edge This Tuesday?

Tuesday has shown strong inclinations to turn around over the years when there has been a pullback leading up to it.  But when the pullback has been 2 days old and the market has been in a long-term uptrend, that turnaround inclination has not held true.

Whose fault is that?  Not the overnight.
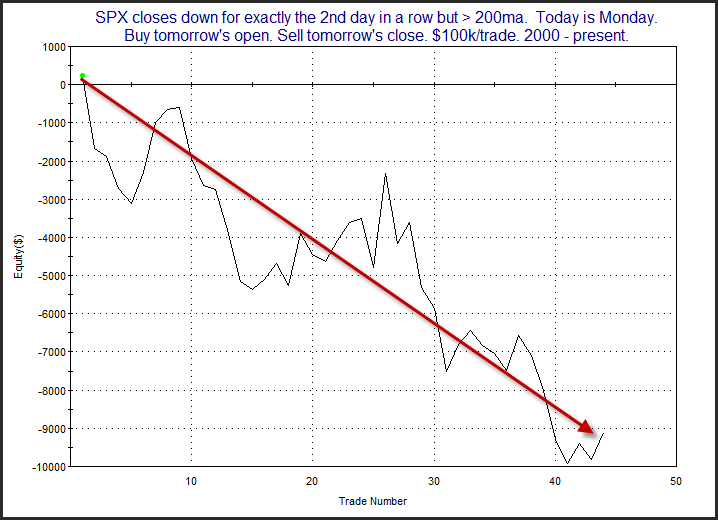
It’s been the day session.  Below is a are the results of going long Tuesday morning after a 2-day pullback during an uptrend, and then exiting at the close.
As you can see, the stats show a moderate downside inclination.  I also produced a profit curve to see how this has played out over time.
A bit choppy, but it has been headed lower for a long time.  Traders may want to be a little cautious about jumping aboard the “Turnaround Tuesday” train today.  The market has historically struggled between open and close under similar scenarios.

Recording of Quantifiable Edges MTA Webinar

I am out of the office again today.  The blog will return to normal next week.  But if you cannot wait that long for some Quantifiable Edges research, below is a link to an MTA webinar I recently did.  This one discussed trading edges related to long-term, short-term, and overnight trading.

The MTA, which stands for Market Technicians Association, is a top-notch organization.  I would recommend all traders interested in technical analysis check it out and see what they have to offer.

Here is a link to the July 17 2013 webinar:
Quantifiable Edges for Trading” 
 
And here is a link to the MTA website in case you would like to learn more about it:
https://www.mta.org/eweb/StartPage.aspx

Overnight Trading Presentation

I have been taking some time away in the last couple of weeks.  And while the subscriber service has carried on as normal, the blog has suffered.  I’ll be back in a few days to again ramp up the blog.  But for those of you who are yearning for some Quantifiable Edges, feel free to check out the presentation I did with Tradestation near the end of June. 


Overnight Edges – Using Historical Tendencies to Anticipate Overnight Market Movement” – A webinar given June 18, 2013 as part of Tradestation’s “Spotlight On…” series.

The 3-Day Pattern That Suggests A Bearish Edge For Today

The last 3 days have created an interesting setup.  Thursday SPY made a new 50-day closing high.  Friday SPY posted an inside day.  And then Monday was another 50-day closing high.  This has only happened 16 other times since 1999.  Below is a list of all the instances along with their performance the next day.

Risk/reward here heavily favors the short side. The average drawdown is nearly 4 times the size the average run-up. Also notable is that every instance saw drawdown of at least 0.35% the next day, but only 1 of the 16 instances saw run-up of at least 0.35%.  Futures are up 2.5 points right now about an hour before the open, but there may be some headwinds based on this pattern.

This Setup Suggests More Upside In The Next Few Days

Thursday marked the 2nd day in a row that SPY posted an unfilled gap up.  It also closed at a 50-day high.  The unfilled up-gaps are considered a sign of strength.  Unfilled up gaps can sometimes be seen as a sign of strength.  The study below examines whether this may be the case when the market is at an intermediate-term high.

The size of the follow-through isn’t terribly large, but it has been very, very consistent that some follow through was achieved.  This suggests a good chance at more upside in the next few days.

I will note that not every study I am seeing is bullish right now.  There is a bit of a mix.

Sometimes Overbought Suggests More Strength

When the market begins to get overbought it will often suggest a pullback is likely.  When overbought gets powered through then odds will sometimes shift from a pullback to a continuation of that move.  The last two nights I have seen some studies suggesting this scenario.  The study below is on that I have showed a few times in the past.  All stats are updated.

These results appear to suggest a pretty consistent upside edge over the next 1-3 weeks.  In fact, below is a profit curve showing just how consistent it has been over the years using a 10-day exit.

That’s an impressive upslope for a period covering over 50 years.

When VXO is Stretched to the Downside

One index providing interesting readings is VXO (the old VIX calculation).  On Monday it closed a little more than 15% below its 10ma.  And it may do that again today.  At one time, such rapid drops in the VXO were often followed by a move lower in the SPX.  But this has not been as consistent in recent years.  Below is a study I showed in last night’s Subscriber Letter.

Stats here seem to suggest a bit of a downside inclination.  But the equity curve tells a little bit of a different story.

The downside edge seemed apparent for the 1st 60 instances or so.  But the last 25, all of which occurred over the last 3 years since June 2010, have been extremely choppy and shown no progress.  For whatever reason the market seems to have changed, and traders should be aware of that.