Early April’s Bullish Inclination

The study below is one I have shown here on the blog a few times over the years. It examines the bullish inclination the market has had in early April.

2017-04-03

Numbers here appear impressive. Of further note, sixteen of the 1st eighteen years were higher on day 4, but the 2012-2014 instances saw mild declines. Meanwhile, the 2-day time period has been positive 10 of the last 11 years, with 2015 being the only loser and closing down less than 1 SPX point. So potentially bullish early April seasonality is something traders may want to keep in mind the next few days.


Want research like this delivered directly to your inbox on a timely basis? Sign up for the Quantifiable Edges Email List.

When “Turnaround Tuesday” Failed…

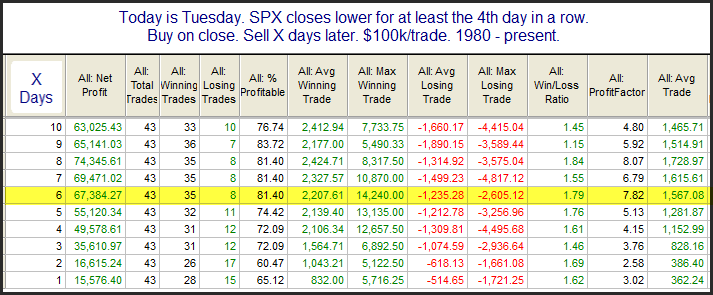
A few times over the years I have shown studies related to “Turnaround Tuesday”. The bottom line is that when the market has pulled back for multiple days, going into a Tuesday, then Tuesday has seen a bounce begin on a more reliable basis than any other day of the week. That sure didn’t happen yesterday. Historically, when there hasn’t been a close higher on Tuesday after a 3-day pullback, what does that mean for Wednesday and beyond? The test below addresses that question.

2017-03-22

Results here have been very strong over a long period. In the past the “Turnaround Tuesday Failure” has just been a temporary setback.


Want research like this delivered directly to your inbox on a timely basis? Sign up for the Quantifiable Edges Email List.

Updated Look At Opex Week Broken Down By Month

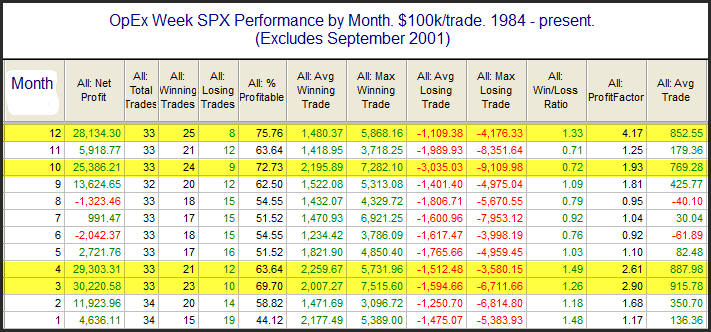
I’ve noted a number of times that Op-ex week in general is pretty bullish. March, April, October, and December it has been especially so. S&P 500 options began trading in mid-1983. The table below is one I have showed in March each of the last several years. It goes back to 1984 and shows op-ex week performance broken down by month. All statistics are updated.


2017-03-13


While December has been more reliable, March op-ex week has seen the most in total gains. Traders may want to keep this in mind this week, and refer back to the table in future months.


Want research like this delivered directly to your inbox on a timely basis? Sign up for the Quantifiable Edges Email List.

New President…New Optimism?

In the 1/20/09 blog eight years ago I looked at inauguration day returns. I examined whether a new president brought about new hope and optimism for the market.

I limited the instances to only those inaugurations where a new president was entering office. I don’t think re-elections carry a sense of “new hope” the way a new president does. I also eliminated inaugurations of Presidents that weren’t elected (Ford in ’74, Johnson in ’63, Truman in ’45, and Coolidge in ‘23). I just don’t believe the same sense of excitement is generated by a replacement as by a newly elected president.

That left me with the following 12 instances:
March 4, 1921 – Warren G. Harding
March 4, 1929 – Herbert Hoover
March 4, 1933 – Franklin Roosevelt
January 20, 1953 – Dwight Eisenhower
January 20, 1961 – John Kennedy
January 20, 1969 – Richard Nixon
January 20, 1977 – James Carter
January 20, 1981 – Ronald Reagan
January 20, 1989 – George H.W. Bush
January 20, 1993 – William Clinton
January 20, 2001 – George W. Bush
January 20, 2009 – Barack Obama

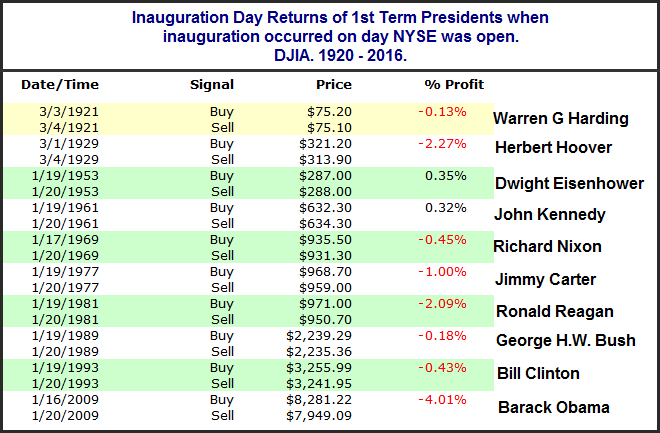
First I looked to see how the market performed on the day of the inauguration. Surely the wonderful speeches and overall positive vibes would have had a positive effect on the market:
2017-01-20-1

Then again, perhaps not. Eisenhower wins the award for most market-friendly speech by juicing the Dow for 0.35%. Obama was the biggest loser with a 4% drop on his inauguration day. George W. Bush and Franklin Roosevelt are not included on the list since their 1st inaugurations were on weekends.

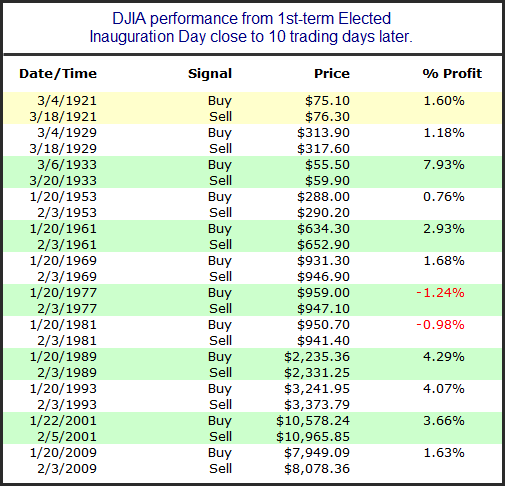
What if we look out a little longer, though? Buying on the close of inauguration day (or 1st day after for W. Bush and Roosevelt) and holding for 10 days offered significantly more positive results:
2017-01-20-2

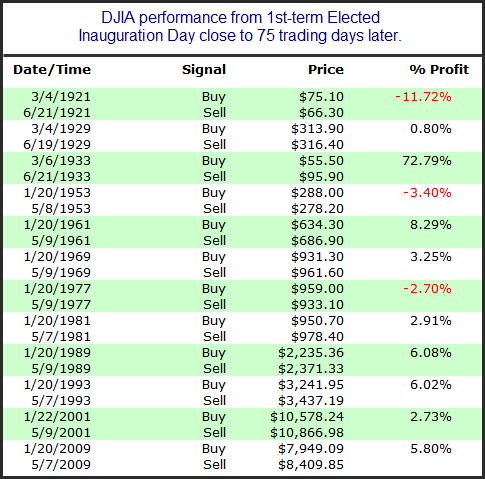
The 10-day timeframe has shown some very positive results. For an intermediate-term perspective below are the results for the 1st 75 trading days of the new presidency:
2017-01-20-3

Mostly positive here as well. Of course the main issue with this line of tests is that we are dealing with only 12 instances in 98 years. It would be quite dangerous to base any trades on just these results.


Want research like this delivered directly to your inbox on a timely basis? Sign up for the Quantifiable Edges Email List.
January Opex Struggles

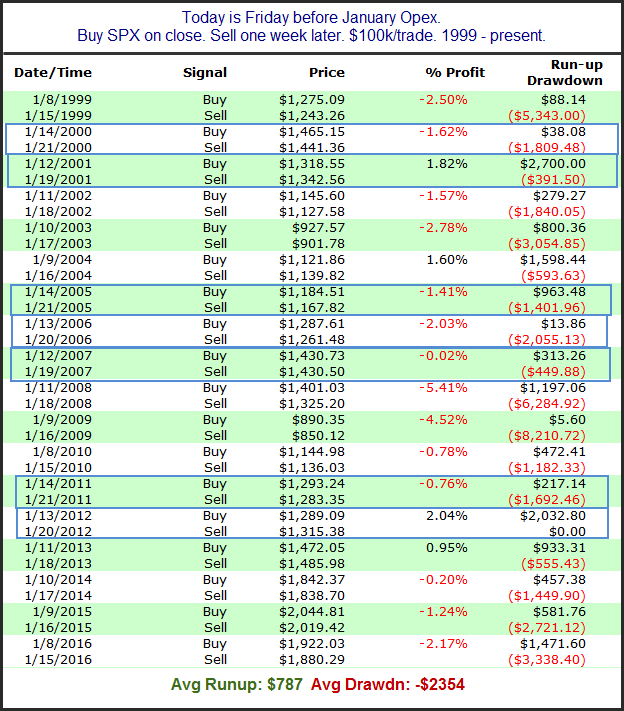
Opex week in January is one that the market has seen some struggles over the last 18 years. Below is the list of January op-ex weeks from 1999 – 2016 with their full week performance results. There have been 7 years in which January op-ex week occurred in conjunction with Martin Luther King Day. These were 4-day weeks and they are denoted with blue boxes around them.

2017-01-16

There has been a decided downside tendency during January opex week over the last 18 years. The run-up / drawdown stats are especially notable. Traders may want to keep this in mind this upcoming week.


Want research like this delivered directly to your inbox on a timely basis? Sign up for the Quantifiable Edges Email List.
Why Today’s Fed Day Does Not Appear Bullish As Usual

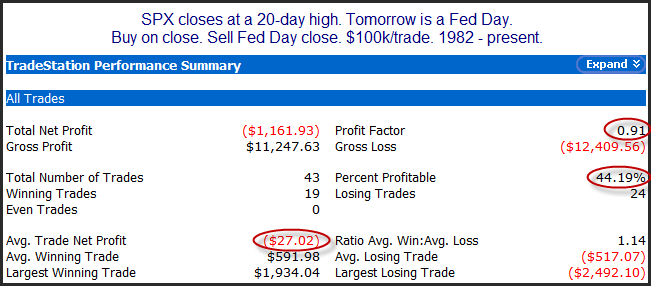
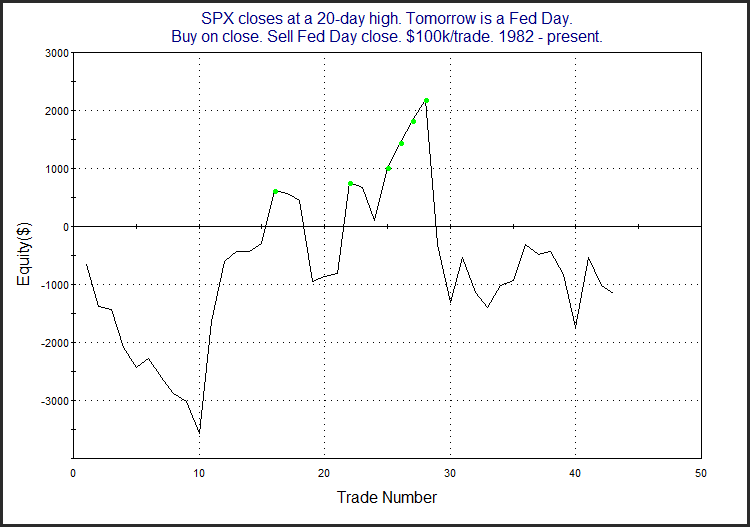
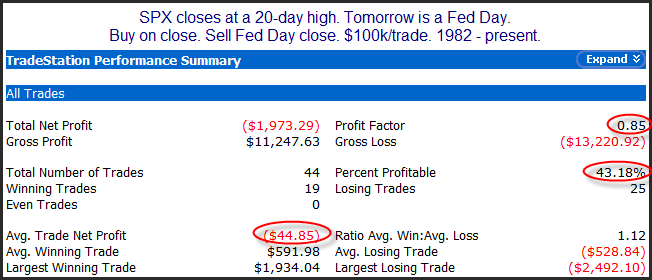
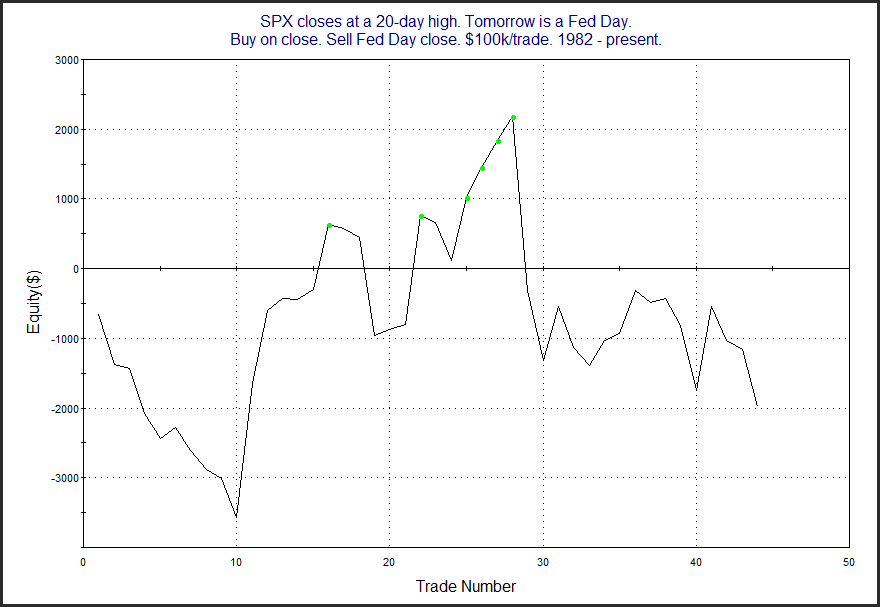
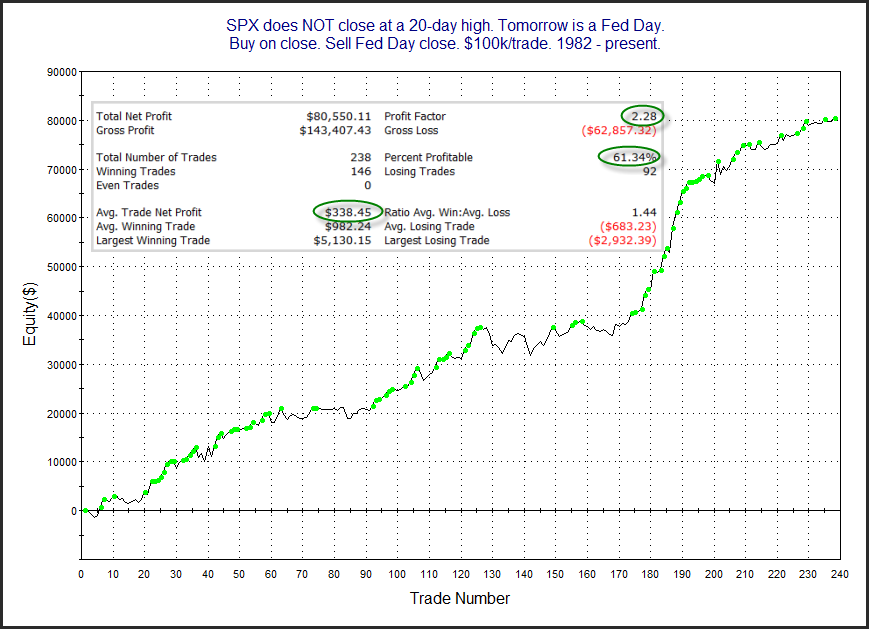
Wednesday is a Fed Day. Fed Days have historically shown an upside tendency. I have documented this tendency in great detail over the years, with the most complete documentation coming in The Quantifiable Edges Guide to Fed Days. Based on what the market did Tuesday, this does not seem to be the most favorable Fed Day setup. A big reason for this is that SPX closed at a 20-day high on Tuesday. Fed Day bullishness has often occurred when a Fed announcement has helped to alleviate market stress. When the market closes at a 20-day high, it typically means there isn’t a lot of worry present. Under these circumstances, the upside inclination has also not been present. This can be seen in the study below.
2016-12-14-1


2016-12-14-2

Neither the stats table nor the profit curve suggest any consistency or tradable edge.

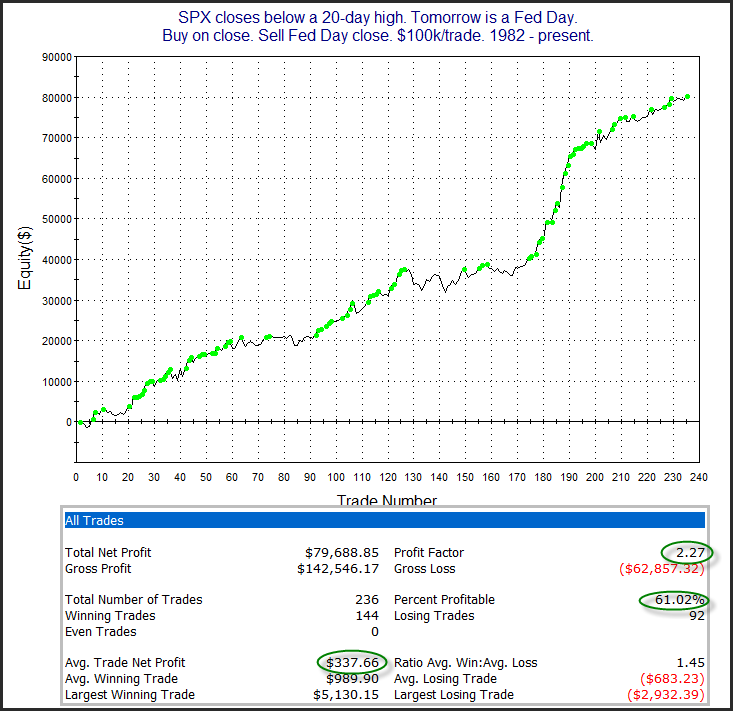
As a comparison, here is a profit curve of all Fed Days when SPX did NOT close at a 20-day high the day before.

2016-12-14-3


Want research like this delivered directly to your inbox on a timely basis? Sign up for the Quantifiable Edges Email List.
The… Most… Wonderful… Weeeeek… Of…The… Yeeeaaaarrrrr!!

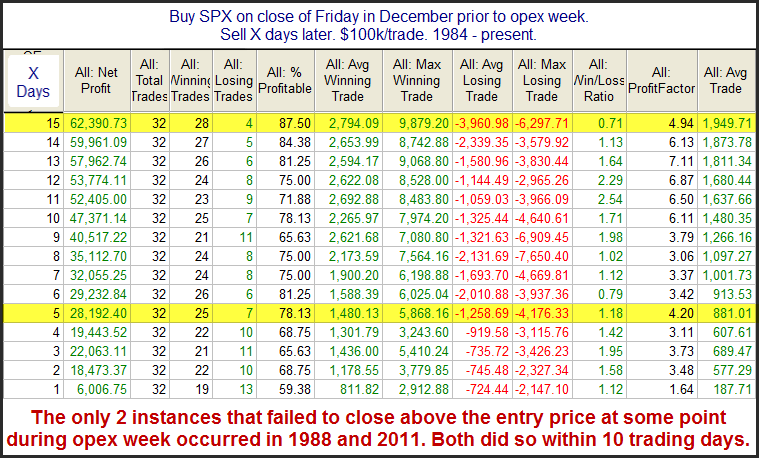
Over several time horizons op-ex week in December has been the most bullish week of the year for the SPX. The positive seasonality actually has persisted for up to 3 weeks. I’ve shown the study below in the blog many times since 2008. It looks back to 1984, which was the first year that SPX options traded. The table is updated again this year.


2016-12-12


The stats here remain extremely strong. Have a wonderful (and bullish?) December Opex Week!


Want research like this delivered directly to your inbox on a timely basis? Sign up for the Quantifiable Edges Email List.
Thanksgiving Week Edges

The time around Thanksgiving has shown some strong tendencies over the years – both bullish and bearish. In the table below I show SPX performance results based on the day of the week around Thanksgiving. The bottom row is the Monday of Thanksgiving week. The top row is the Monday after Thanksgiving.


ThanksgivingWeek


Monday and Tuesday of Thanksgiving week do not show a strong, consistent edge. But the data for both Wednesday and Friday looks quite strong. Both of those days have seen the S&P 500 rise over 70% if the time between 1960 – 2015. The average instance managed to gain about 0.3% for each of the 2 days. (This is shown in the last column “Avg Trade where $300 would equal a 0.3% gain.) That is a hearty 1-day move. Meanwhile, the Monday after Thanksgiving has given back over half the gains that the previous 2 days accumulated. It has declined 64% of the time and the average Monday after Thanksgiving saw a net loss of 0.37%.


Of course I am not the first person to notice this. Strong Thanksgiving seasonality has been noted by many analysts over the years. So one (valid) concern that traders have with well-known seasonal tendencies is that they can be easily front-run. If people know there is a good chance that the market will rise Wednesday through Friday, they will look to get long on Tuesday. And if all the people buy ahead of the bullish period, then that may either dilute or eliminate the seasonal edge.


From 1960 – 1986 someone who bought Tuesday’s close and sold Friday’s close would have seen the SPX decline only 1 time. But from 1987 – 2015 there were 8 instances where SPX did not close higher on Friday than it did on Tuesday. So perhaps the edge became so well known that it was diluted by front-running.


To determine whether the Wednesday – Friday Thanksgiving edge may have been front-run a particular year, you could examine price action. I have repeatedly found that a market that is oversold going into a strong seasonal period will perform better than a market that is overbought going into a strong seasonal period. A very simple metric that could be used in this case would be to see whether the market closed in the top or bottom half of its intraday range on Tuesday of Thanksgiving week. To do this I used SPY instead of SPX, because it had better intraday data.


Since 1993, I found that years in which SPY closed in the top half of its intraday range on Thanksgiving Tuesday posted a 7-5 record from Tuesday’s close to Friday’s close. When SPY closed in the bottom half of its range on Tuesday the performance over Wednesday to Friday was 10-1. And the average instance posted a 0.8% gain these years versus a 0.1% average gain the other years. So Tuesday’s action appears worth watching as we approach this potentially seasonally bullish period.


Want research like this delivered directly to your inbox on a timely basis? Sign up for the Quantifiable Edges Email List.
Twenty-Day Lows Ahead of Turnaround Tuesday

Tuesday’s have a well-earned reputation for being days where bounces tend to begin. The study below is from last night’s letter. It was also shown in the Quantifinder yesterday afternoon. It examined other times that the SPX closed at a 20-day low on a Monday. Results have been updated.

2016-10-18 image1

Stats here appear strongly bullish. It is also worth noting that since 2013 there have been 9 winning trades in a row (when looking out 4 days). Traders may want to keep this in mind over the next few days.


Want research like this delivered directly to your inbox on a timely basis? Sign up for the Quantifiable Edges Email List.
October Opex Week Has Historically Been Bullish

From a seasonal standpoint option expiration week is often a pretty good week for the market. October is one of those months where it has been especially good over the years. The study below examines performance during October op-ex week.

2016-10-17 image1

I decided to exclude 2008 because action that week was such an incredible outlier that it greatly skewed all the stats. (The week started with an 11.5% gain on Monday of 2008.) Results 1-4 days out look pretty solid. So the bulls appear to have some seasonal forces on their side this week.
Want research like this delivered directly to your inbox on a timely basis? Sign up for the Quantifiable Edges Email List.

The Weakest Week Is Back

From a seasonality standpoint, there isn’t a more reliable time of the year to have a selloff than this week. In the past I have referred to is as “The Weakest Week”. Since 1961 the week following the 3rd Friday in September has produced the most bearish results of any week. Below is a graphic to show how this upcoming week has played out over time.

2016-09-19 image1

As you can see the bearish tendency has been pretty consistent over the last 55 years. There was a stretch in the late 80’s where there was a series of mild up years. Since 1990 it has been pretty much all downhill. Below is a table showing results of buying Sept. op-ex Friday and then selling X days later from 1990 – 2015.

2016-09-19 image2

The consistency and net results appear quite strong. I note the only instance that didn’t post a lower close at some point during the following week was in 2001. And the 9/11 attacks certainly made for unusual circumstances that year.


Want research like this delivered directly to your inbox on a timely basis? Sign up for the Quantifiable Edges Email List.
Sharp Decline in VXO and the New Market Environment

Yesterday I showed a VIX-related study that suggested it was so stretched to the upside that the market was likely to get a quick bounce. And we certainly got one on Monday. The VIX is a measure of options pricing and is often referred to as a “fear index”. It saw a 13% drop on Monday. Meanwhile, the VXO, which is the old calculation of the VIX declined nearly 23%. Such big declines often suggest short-term over-optimism on the part of traders and are followed by a dip the next day. This can be seen in the study below.

2016-09-13 image1

Numbers here suggest a downside edge for Tuesday. I’ll note that there are some other studies I am seeing that show short-term bullish inclinations. But the way the VIX and VXO are jumping around, we certainly seem to have entered an emotional, reactive market environment. Such environments can be prone to whippy action. Traders should anticipate a market that is much different than the quiet, tight ranges we experienced from mid-July through early September.


Want research like this delivered directly to your inbox on a timely basis? Sign up for the Quantifiable Edges Email List.
What The VIX Spike Is Suggesting For The Next Few Days

Friday’s big drop was accompanied by a big spike in options prices as measured by the VIX. The VIX rose so sharply that it closed Friday 32% above its 10-day moving average. The study below examines stretches of 25% or more, and how the SPX has performed in the following days.

2016-09-12 image1

Very impressive consistency. Sizable bounces seem to have been the norm under these circumstances. There seems to be a decent chance of a bounce in the next few days – and this is not the only study I examined this weekend that is suggesting that.
Want research like this delivered directly to your inbox on a timely basis? Sign up for the Quantifiable Edges Email List.

Tight Consolidations After New Highs

The range over the last week has been extremely tight. On 7/20/16 SPY closed at a 50-day high. Every SPY close in the 5 days since 7/20 has been within the intraday range of that 7/20/16 bar. (And it wasn’t even that big of a range.) It is said that consolidations are often resolved in the direction of the trend. This guideline suggests that we’re more likely to see another leg up from here than a breakdown. The study below tests this concept.

2016-07-28 image1

It certainly appears to confirm the old technical adage. Results favor the long side over the immediate 3-day period and they are even more impressive when looking out 8 to 10 days.


Want research like this delivered directly to your inbox on a timely basis? Sign up for the Quantifiable Edges Email List.