One study from the Quantifinder that triggered last has some potential intermediate-term implications, and it is fairly interesting, so I figured I would share it. This study looked at the SPX closing price in relation to its 50-day Bollinger Bands, and the fact that we are now extended upwards. I used 2 standard deviations in the Bollinger Band calculation. I used %b to measure where we fell. For those unaware %b simply measures the distance between the 2 bands. So a reading of 0 means price is right at the lower band. A reading of 100 is right at the upper band. A reading of 50 would be right at the moving average being used – in this case the 50ma. So a move 2 standard deviations above the 50ma would be a %b reading of 100.
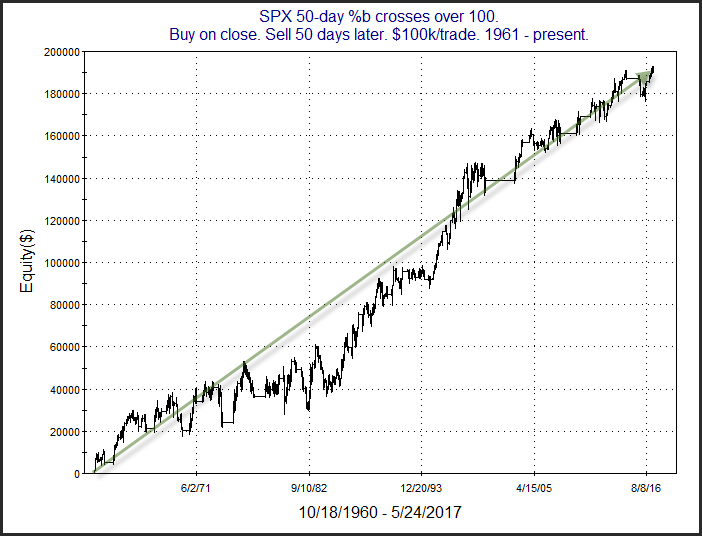
When I looked out over the next 5 – 50 days, results all appeared fairly bullish. They suggested that the kind of strong momentum that would lead SPX to close above its 50-day Bollinger Band favored more upside over a possible reversal. Below is a profit curve showing how the setup would have played out from 1961 – present.

The positive slope over such a long period is encouraging. Generally, such extended conditions like we are currently seeing have exhibited enough strength that they were more likely to lead to more strength than to weakness. We could see the current momentum persist a bit longer.
Help me make the Quantifiable Edges Bike-MS Fund Raising Drive a success and take advantage of a very special offer on our Fed Day research! Click here for details!
Want research like this delivered directly to your inbox on a timely basis? Sign up for the Quantifiable Edges Email List.
