How Has The Market Performed After Election Day?

Happy Election Day!  (Or is it Merry Election Day?)  Here is one view of how the SPX has fared following US elections from 1964 – 2008.

There is not a lot to glean from this.  But I would point out a couple of things.  1) Much of the negative total returns came thanks to the “Max Losing Trade”, which was 2008. 2) The “Max Winning Trade” over the next week is barely 3%.  So the election has not in years past served as a spark that led to a sharp rally.

Employment Days Just Ain’t What They Used To Be

Employment days have an interesting history and they have contributed to some worthwhile studies over the years.  By “Employment Day” I mean days that the Federal Employment Report will be released.  This occurs once per month and is normally on the 1st Friday of the month. Below is a chart of SPY performance on Employment Days during bull market environments.  Each trade was a fictional $100k.

What I find so interesting about the chart is that for a long time Employment Days in uptrends showed a strong propensity for gains.  But in 2000 this edge vanished.  Since then there has been no apparent advantage – bullish or bearish.  While it’s unusual to see such an abrupt change in market dynamics, it does serve as a nice reminder that such changes are always possible.

When Fed Days Close at Intermediate-Term Lows

In last night’s letter I examined 20-day lows that occur on Fed Days during long-term uptrends. The results appeared interesting. You’ll find the stats table below.

Over the first 1-4 day period there doesn’t appear to be much of an edge. But over the 5-10 day period the market has reliably risen. Instances are low, but I still thought the two-week results were strong enough to keep in mind and give some consideration.

Big Gaps Down the Day Before a Fed Day

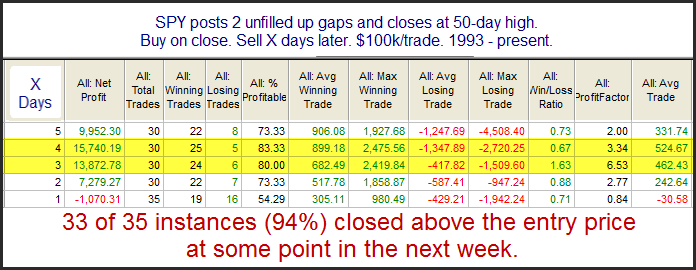
The pre-market indications are for a gap down of about 1% as I write this around 8:20am EST.  With tomorrow being a Fed Day I decided to see how the market has performed other times it has seen large gaps down on the day prior to a Fed Day.  This first study looks at performance from open to close on the day of the gap down.

Note that the only instance that did NOT gap down at least 1% was the last one on 12/12/11.  Instances are low.  Initial returns are mixed with a mild bearish tilt.

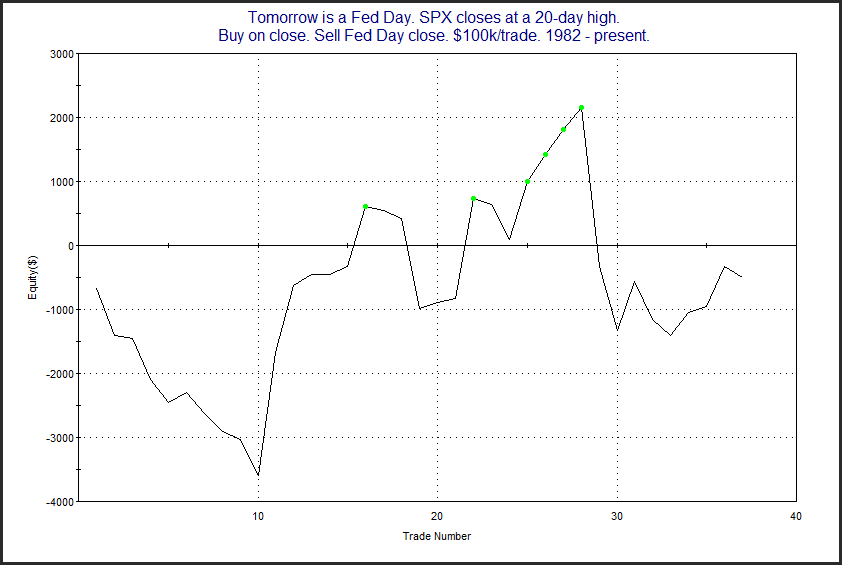
Now let’s see what happens if we hold through the Fed Day.

Here we see a big turnaround.  All the 1% gaps down turned net positive from their opens.  And the only instance not to see a gain of greater than 1% on the Fed Day was the last one (which gapped down less than the others to start). It added to its day 1 losses.

How the Market has Historically Reacted to Very Bad Fridays

In the April 19, 2010 blog I showed a compelling study that examined large drops on Fridays.  Both the Crash of ’29 and the Crash of ’87 happened on Monday.  The Crash of ’87 is still remembered by many traders that are active today.  There was a strong selloff on Friday and then all hell broke loose on Monday.  But since then strong Friday selloffs have commonly been followed by bounces on Mondays.  Perhaps this is due to the fact that fear of a crash causes what might otherwise be an ordinary selloff to become exaggerated and overdone on Fridays.  Or perhaps it is just that people don’t want to hold over the weekend.  Whatever the reason, the tendency to bounce has been very strong.  I’ve updated that 4/19/10 study below.

The numbers here are all very impressive and suggest a strong bullish bias.

A Seasonal Look At October Op-Ex Monday

Opex week during October has typically been a strong week for the market.  This can be seen in our op-ex week breakdown by month from March.  And much of the upside edge has been thanks to the strong op-ex Monday returns.  But op-ex Monday in 2008 was SO unusually strong (11.5% 1-day gain) that I decided to run the numbers excluding it.  So here is a look at October op-ex Mondays since 1984 not including 2008.

As you can see the numbers are still very favorable.  There appears to be a bit of a bullish seasonal edge today.

A Bounce Study Suggesting More Downside

In an older study in the Subscriber Letter I looked at bounces after SPX is strongly short-term oversold as measured by RSI(2).  What I found in that letter was that lower-volume instances on the first day of the bounce have performed much better over the next few days than higher-volume bounces.  I won’t rehash the whole study here, but I will show performance following higher volume bounces like Thursday.

As you can see, it appears that such bounces suggest a short-term downside edge.

One reason the blog has been slow this week is that I am preparing for my trip to Atlanta next week to speak at the MTA meeting there.  If you’re in the Atlanta area and would like more info on my talk you may check out the link below.  You don’t need to be an MTA member to attend, but you should consider joining.

https://www.mta.org/eweb/dynamicpage.aspx?webcode=atlanta

A Columbus Day Edge Revisited

While the stock market is open on Monday, banks, schools, government offices, and the bond market are closed.  In past years with the bond market closed, the stock market has done quite well on Columbus Day.  Of course the most famous Columbus Day rally was in 2008 when the market gained over 11% after having crashed the week before.  Last year in the 10/10/11 blog I showed that positive momentum leading up to Columbus Day has generally led to a positive Columbus Day.  Columbus Day has been celebrated on the 2nd Monday of October since 1971.  Below is an updated version of last year’s study.

I’ve circled some of the more impressive stats here.  With 77% of trades profitable and winners twice the size of losers risk/reward has been very favorable.

What Yesterday’s VIX Action Hints At For Today

Somewhat unusual about the rise in the SPX Monday was that it was accompanied by a rise in the VIX as well.  Most of the time they mirror each other.  One quirk with the VIX is that it has a tendency to fall on Fridays and rise on Mondays. Therefore this setup is more common on Mondays than any other day of the week. The table below examines performance on Tuesdays after this has occurred.

I only show 1-day results here because anything longer shows no inclination.  And while the edge here isn’t terribly strong, it is interesting that the VIX’s inclination to rise on Mondays does not seem to completely eliminate the tendency for the SPX to pull back the next day.  Of course if this setup happens on a Friday, then the downside edge is more pronounced.

This Pattern Has Always Led to Higher Closes for SPY

The price action in SPY showed some real strength in that it gapped up, never filled, and closed above the open.  When the market is coming off an oversold level in an uptrend and is still not overbought, this pattern will often be followed by further gains.  This was shown in the subscriber letter last night (click here for a free trial).  And in the 5/22/12 letter I also showed that when the SPY pattern occurs following a short-term low it appears to provide a bullish edge, but when it occurs after an intermediate-term low then the bullish inclinations no longer hold true.  The current setup is bullish and I have updated the stats below.

The reliability and the size of the moves are both impressive.  This study suggests the rough start this morning is likely to be overcome in the next few days.

What Happens In Vegas

The International Traders Expo is going to be at Caesar’s Palace from November 14-17, 2012.

I’ve been to this expo a couple of other times and have really enjoyed it.  I’m pleased to announce I’ll be back this year and giving a presentation on Saturday the 17th from 1:15pm – 2:15pm.

The topic of my presentation will be “Overnight Edges – A Quantitative Look at Overnight Market Movements and Opportunities”.  I’ll be covering a lot of my newest and most compelling research with regards to the overnight market.

For more information and to register for the expo (free), click here.

I hope to get the opportunity to meet many readers and subscribers at the Expo.

Turnaround Tuesdays Revisited


It’s been a while since I updated the Turnaround Tuesday study, so I thought I would do so today.  The stats tables below all show results of buying at the close when SPX is down for a certain number of days and the exiting the following day.  The results are broken out by day of the week.  Note that the day listed is the trigger day – not the performance day.  So the Monday trigger tracks Tuesday’s performance.  Tuesday’s trigger tracks Wednesday’s performance…and so on.

In every case Tuesday has shown the most gains – hence the Turnaround Tuesday reputation appears well earned.  Though it wasn’t the highest percentage in every case, it was the strongest day on average.

Interestingly, I this time I also looked at instances where the SPX had pulled back more than 3 days.  Those results are shown below.

Under conditions of a 4 day or greater pullback Tuesday has disappointed.  Monday has been the standout winner.

The Weakest Week (updated)

Last year I showed that the week following September options expiration has historically been the most bearish week of the year. 2011 didn’t do anything to make the stats look any more bullish.  Below is an updated chart showing the persistently poor performance since 1961.

As you can see the bearish tendency has been pretty consistent over the last 51 years.  There was a stretch in the late 80’s where there was a series of mild up years.  Since 1990 it has been pretty much all downhill.