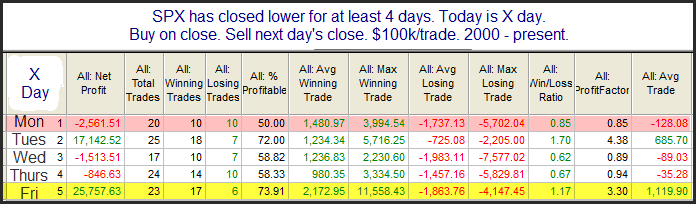
It’s been a while since I updated the Turnaround Tuesday study, so I thought I would do so today. The stats tables below all show results of buying at the close when SPX is down for a certain number of days and the exiting the following day. The results are broken out by day of the week. Note that the day listed is the trigger day – not the performance day. So the Monday trigger tracks Tuesday’s performance. Tuesday’s trigger tracks Wednesday’s performance…and so on.
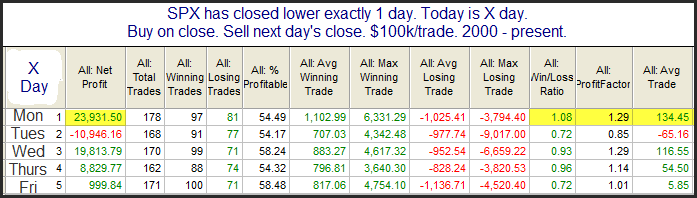
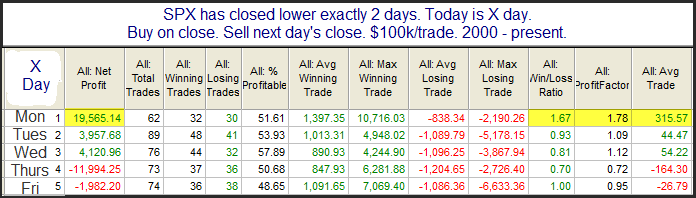

In every case Tuesday has shown the most gains – hence the Turnaround Tuesday reputation appears well earned. Though it wasn’t the highest percentage in every case, it was the strongest day on average.
Interestingly, I this time I also looked at instances where the SPX had pulled back more than 3 days. Those results are shown below.