Consistent Closes Near the Top of the Daily Range – And What That Could Fortell

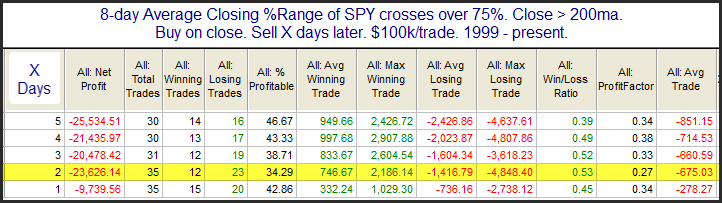
The market has seen a lot of finishes near the top of its daily range lately.  When the market consistently closes near the high of the day it suggests optimism on the part of traders. This end-of-day optimism is now at a level that suggests it is a bit overdone and there is a good chance of a pullback. The study below was last seen in the 7/5/12 blog and it exemplifies this concept. I have updated all of the statistics.

While the downside edge appears to remain in place for a full week, most of the edge has been realized over the 1st 2 days.

Note: To calculate the “8-day Average Closing % Range” I am simply measuring where in the daily range SPY closed each day. For instance if it traded at a low of $141.00 and a high of $142.00 and closed at $141.75, then it would have closed in the 75th percentile of the daily range. A close at $141.50 would have meant 50%.

I then take a simple moving average of the last 8 days. If that average goes from below 75% (where it usually is) to above 75%, the study is triggered.

Quantifiable Edges new baby – Overnight Edges

I can’t tell you how excited I am to announce the launch of Overnight Edges. Overnight trading is something I’ve spent years studying, implementing, and refining.  I’ve kept quiet about it for far too long.  Now I’m finally ready to share it with the world!  I’ll write more on it in the near future, but today I just wanted to formally announce that Overnight Edges is LIVE!  Check it out at

Is The Recent Consolidation Bullish?

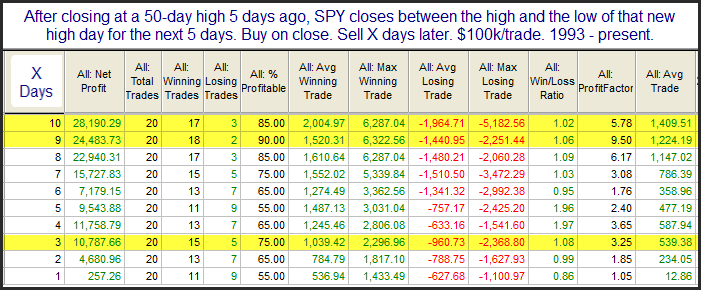
The range over the last week has been extremely tight.  Every SPY close in the 5 days since 8/7 has been within the daily range of that 8/7/12 bar.  It is said that consolidations are often resolved in the direction of the trend.  This guideline suggests that we’re more likely to see another leg up from here than a breakdown.  The study below puts this to the test.

It certainly appears the old technical adage has some merit.  Results favor the long side over the immediate 3-day period and they are even more impressive when looking out 8 to 10 days.

Why The Recent Move Higher May Signal More Gains

One possible market positive is that prior to small drop Monday’s drop the SPX was locked in a persistent rally. I’ve shown a few different ways in the past that persistent rallies are unlikely to end abruptly. Instead they will either continue higher after a brief pullback, or action will become choppy prior to a sizable move lower. This is shown in the study below.

We see here a decent edge that becomes stronger and more consistent as you look out over the next several days.  The 9-10 day time frame shows exceptional stats.  The 2-day timeframe suggests a quick little boost is also likely.

Implications of 10-yr Bond Rates Hitting New 50-day Highs Along With SPX

Ten year bond rates hit a new 50-day high on Thursday in conjunction with the 50-day high in the SPX.  This is something I have looked at in the past, and the intermediate-term implications suggest possible difficulty.  I’ve shown this study a few times on the blog, most recently last October 31st.  The last time it triggered was March 13th.  I have updated the results below.

Generally it seems that higher interest rates have often made bonds an attractive investment. This may have lead people to forsake stocks in favor of lower risk returns with improved yield.  Of course the “high” yield we are now seeing certainly does not seem high.  Still, this study has triggered a number of times over the last several years and it continues to suggest struggles for the SPX.  So it seems worth being aware of.

A Bullish Study That is Re-Triggering

I mentioned yesterday that I am seeing a real mix of studies, and that remains true.  So after showing one for the bears yesterday, let’s look at a bullish one today.  You’ll hopefully recognize it because it last triggered just over a week ago.  I showed it in the July 30th blog and have updated the results below.

The last instance was followed by a 4-day pullback and then a very large rally on day 5 that wiped out all the losses.  Results have consistently led to at least some upside over the short-term.

There remain both positives (like today’s study) and negatives (like yesterday’s) to take into account.  Perhaps a little caution is warranted.

A Gap Pattern Suggesting A Pullback

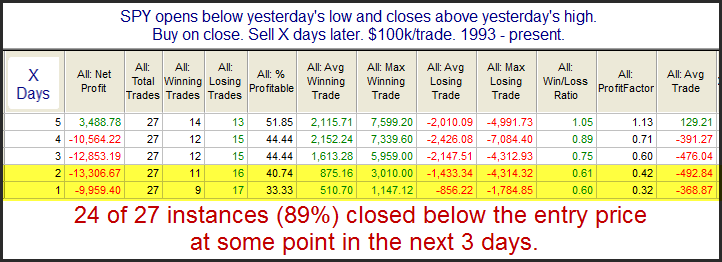
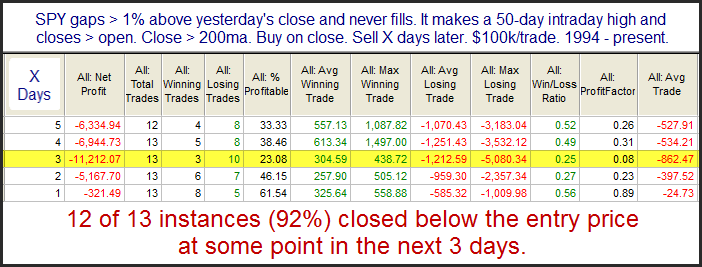
I am seeing a real mix of studies right now.  The one below makes a short-term argument for the bears.  It examines the unfilled gap pattern that emerged in the SPY on Friday.   The study was last shown in the 10/28/11 subscriber letter. I ran it again this weekend.

The number of instances is a bit low, but the consistency is strong enough and the statistics lopsided enough that I think it is still worth taking the study under consideration.

Recent Blogroll Additions

While I have made some recent additions to the blogroll, I have neglected to mention them on the blog.  So I thought I would do so quickly, since they all deserve to be pointed out.

The Whole Street’s Quant Mashup

This is a fairly new site, but they have put together a nice list of quant-oriented blogs.  Several can be found on my blogroll, but there were a few that I had never even heard of.  So I have some more exploring to do with some of these.

The McVerry Report

Joe McVerry has put together quite a list of blogs that can easily be scanned for ideas.

Rogue Traderette

Jess muses about trading.  She’s open, honest and interesting.  A good read.

Cold Hard Football Facts

NFL preseason is set to begin.  Kerry Byrne is an old college friend and he runs the only football “quant” site I know.  He doesn’t just argue about who’s better.  He builds entire stats-based cases.  Right up my alley.

Smallcap Underperformance Exhuasting Itself?

Smallcap action has been poor lately.  Typically you would like to see smallcaps offering upside leadership during a rally.  They certainly have not been doing that.  Wednesday’s smallcap underperformance was quite outsized and I decided to look at other pullback scenarios where the RUT underperformed so badly.  I devised the following study.

Instances are very low, which makes it difficult to generate meaningful expectations.  But somewhat surprisingly results could not be any more bullish.  When I looked at the individual instances I noted that four of the six registered 2%+ gains over the next 3 days.  Perhaps the smallcap downdraft is exhausting itself and the market can manage to rally as it has in the past.

Fed Days on the 1st of the Month

As I mentioned last night, Wednesday is a Fed Day. Fed Days have historically had a bullish inclination. Of course Wednesday is also the first trading day of August. I’ve documented numerous times that since the late 80s the first trading day of the month has had a bullish tendency. So I wondered how the market has performed on days that a Fed Day has coincided with the first trading day of month. There have only been six instances since the late 80s. I’ve listed them all below.

Early indications suggest a possible upside edge, but really we have too few instances to draw any conclusions without overwhelmingly lopsided results. Still, I thought this was interesting enough to share.

Historical Implications Of Recent Gap Action & A New 50-day High

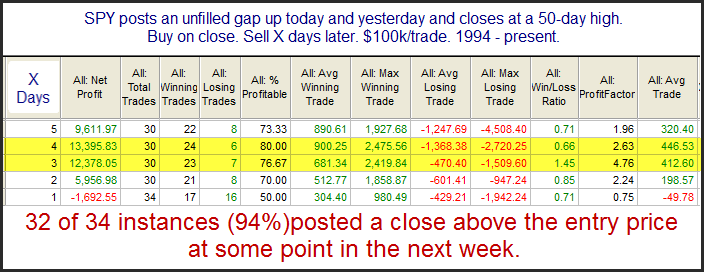
One potential positive about Friday’s breakout is that it occurred with SPY posting its 2nd unfilled up gap in a row. The study below examines the implications of this.

Day 1 is a toss-up, but after that results appear extremely consistent and suggest an upside edge.

We also have a Fed Day coming up. Fed Days have generally been positive but there is a lot to consider.  For those who want to review Fed Day edges you may use the Fed Day label on the side of the blog.  For those that would like an even more complete discussion, you can check out The Quantifiable Edges Guide to Fed Days.

When the Nasdaq Declines but the SOX Rallies Strongly

One interesting aspect of Wednesday’s action is that the SOX (Semiconductor Index) did so well, gaining 1.92%, despite the decline in the Nasdaq.  When this has happened in the past, it has often been the SOX that has been “right” – at least with regards to the following day.  This can be seen in the study below.

The Nasdaq has risen the next day 71% of the time and the average net gain has been over 0.8%.   These are impressive numbers that suggest a 1-day upside edge for the Nasdaq.

The Edge Suggested By 2 Consecutive Unfilled Down Gaps

One notable aspect of the price action over the last 2 days is that both Friday and Monday posted unfilled gaps down – never reaching breakeven at any point during the day.  Since 1998 occurrences have been followed by a strong propensity to bounce over the next few days.  I broke it down a few different ways in last night’s subscriber letter.  But below are the raw results without any additional filtering.

These raw results (whose consistency can be improved by filtering on current market conditions) are still impressive when looking out 1 week.  The pattern of multiple gaps down appears to suggest a short-term bullish edge and is one worth remembering.

Related Quantifiable Edges Studies

What Wednesday’s Move to a 50-day High Was Missing

One notable is that that SPY closed at a 50-day high today (matching the 7/3/12 close).  I’ve shown in the past that a new 50-day high is often more reliable after a period of consolidation.  In this case it has been more than 10 days since we last saw a 50-day closing high.  But unfortunately there is one ingredient that today’s new high was missing – an unfilled gap up.  The study below is from the Quantifiable Edge Subscriber Letter and it examines the importance of an unfilled upside gap.  Below I show closes at 50-day highs that occurred in conjunction with an unfilled gap (unlike Wednesday).

Results here are strong across the board. Technicians will often use the term “breakaway gap”.  This suggests the gap occurs on the same day as a base breakout.  The idea is that the new high causes excitement and the gap leaves a good amount of people sidelined or stuck short.  When it doesn’t immediately fill, it leads these people to chase and helps to propel the market even higher.

Now let’s look at instances where the 50-day high breakout was not accompanied by an unfilled gap.  Interestingly, the number of instances was exactly the same.

As you can see these moves to new highs that don’t start with an unfilled gap are much less reliable.  Unfortunately for the bull case, this is what happened on Wednesday.  The gap down to start the day may not have seemed like a big deal to most, but it means the odds of immediate follow-through are greatly diminished.