Quantifiable Edges CBI Hits 12 On Monday – What That’s Meant For The Intermediate-Term

I’ve written an awful lot about the Quantifiable Edges Capitulative Breadth Indicator (CBI) here on the blog.  The CBI moved up from 7 to 12 on Monday.  While 10 has been a strong indication for a short-term bounce, 11 or higher has been a reliable indication for the intermediate-term. Monday was just the 22nd time the CBI reach as high as 11. Looking out 20 days later, every other instance has been trading higher. Below is the full listing of triggers and the 20-day results.

2014-10-14

As you can see, SPX has been a perfect 21=0 when looking out 20 days from the first CBI reading of 11+.  Drawdowns have been sizable in some cases.  Still, it appears a reading of this magnitude often suggests a washout is in progress that should set the stage for at least a multi-week bounce.  We may not reach the “final” bottom here, but this study indicates we should see at least a temporary bottom form soon.

Free Webinar Today – Quantifiable Edges for Short and Long-Term Trading

I am pleased to be able to say that I will be presenting a webinar this afternoon as part of Tradestation’s terrific “Spotlight On…” series. The topic is “Quantifiable Edges for Short and Long-Term Trading”. I’ll be discussing my approach to studying the market, some of my favorite timing methods, and how long-term indicators impact short-term timing performance.

The webinar is free. It will be held at 4:30pm EST this afternoon. To register you may use the link below:
https://tradestation.omnovia.com/register/33641409863723


Want research like this delivered directly to your inbox on a timely basis? Sign up for the Quantifiable Edges Email List.

Another Study Suggesting The Bounce Continues To Look Good

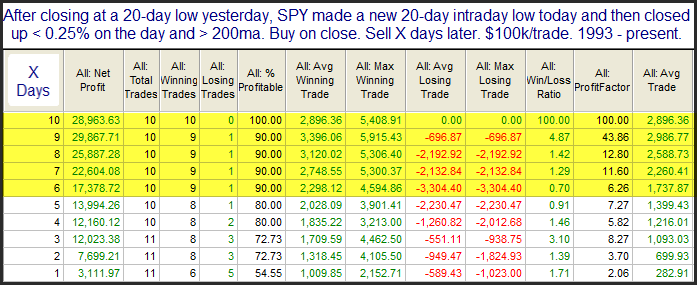
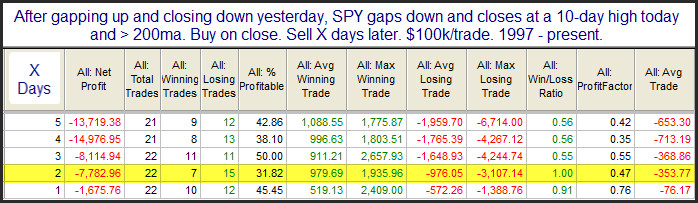
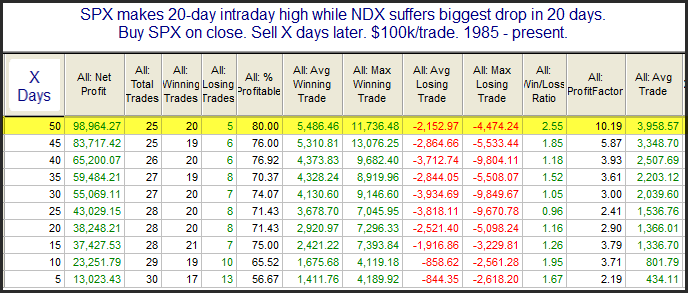
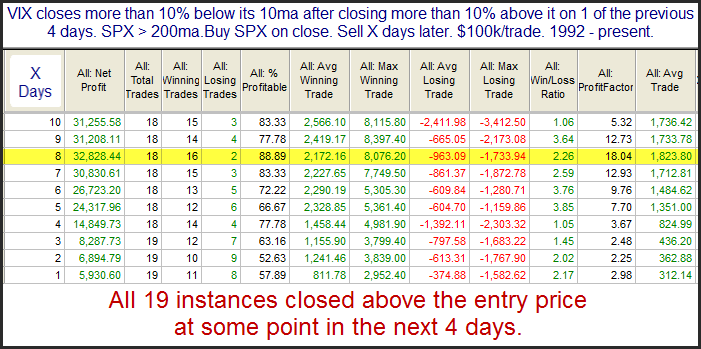
I showed on Friday that the “weak” bounce coming off the 20-day low was not something to be frustrated about. More evidence along those lines triggered Friday afternoon with the following study:

2014-10-06 image1

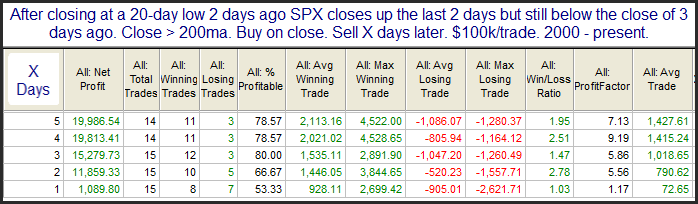
Instances are a little bit low here, but the stats are compelling. I’d also note that all 11 of the instances that closed higher 4 days later did so by over 1%. So the intermediate-term low has often been a nice launching pad. Of course not everything is pointing higher right now. So it will be interesting to see how things play out. But this one narrow view suggests the bounce could have further to go.


Want research like this delivered directly to your inbox on a timely basis? Sign up for the Quantifiable Edges Email List.

The Perfect Record Of A “Weak” Reversal From A 20-Day Low

On Thursday SPY put in a big reversal after hitting a 20-day intraday low. Still, it only closed up a mere $0.03, barely qualifying as an “up day”. In the subscriber letter I examined other instances where this kind of reversal has taken place. I looked back to the inception of SPY in 1993. Below are the results.

2014-10-03 image1

A bit low on instances, but the early indications here are very impressive. Traders may want to keep this in mind over the next couple of weeks.


Want research like this delivered directly to your inbox on a timely basis? Sign up for the Quantifiable Edges Email List.

After Bounces Quickly Fail

Thursday quickly undercut Tuesday’s closing low and put an end to Wednesday’s bounce attempt. How has the market responded under similar circumstances in the past? For the study below, I look at times when a 20-day low was followed by a 1-day bounce and then another 20-day low (when above the 200ma).

2014-09-26 image1

The numbers here look very solid and suggest a bullish edge for Friday. In fact, the setup has done especially well in recent instances. Below I listed the last 18 trades.

2014-09-26 image2

17 of 18 winners is quite the streak.  I will also note that the stats have been substantially less impressive when SPX has been below its 200ma. This edge has only been prevalent during long-term uptrends.


Want research like this delivered directly to your inbox on a timely basis? Sign up for the Quantifiable Edges Email List.

Sell Rosh Hashana and Buy Yom Kippur?

There is an old Wall St. adage that suggests “Sell Rosh Hashana. Buy Yom Kippur.” It implies that between those two holidays that the market often struggles. I looked back to 1998. First, a quick look at the general numbers. (Note – if either holiday was on a weekend then the Friday before was bought or sold.)

2014-09-25 image1

At first glance there appears to be a solid bearish tendency. But the total loss appears to be thanks to primarily 1 instance. Here is a look at all the trades.

2014-09-25 image2

2008 was the big standout here. I wondered what a profit curve might look like without 2008 included. Here is that.

2014-09-25 image3

Very choppy and it has gone effectively nowhere.

Overall, my impression is that there may be some truth to the adage. But the dates are variable. They often fall during times in which there is weak seasonality (like the Weakest Week – this week). So I don’t think there is a reliable trade here, but perhaps the potential weakness is worth keeping in mind.


Want research like this delivered directly to your inbox on a timely basis? Sign up for the Quantifiable Edges Email List.

SPY After Strong Closes For Weak Gains

I’ve seen a few bullish studies in the last few days, but the study below is one with potentially bearish implications for Friday. It is one I have shown a number of times in the past. It shows that when SPY closes strong (in the top 10% of its range) but still only manages a small gain on the day, that the next day has exhibited a downside tendency. Stats are updated..

2014-09-12 image1

Good luck trading today, and have a great weekend!


Want research like this delivered directly to your inbox on a timely basis? Sign up for the Quantifiable Edges Email List.

Possible Implications Of SPY Gap & Reverse Patterns The Last Two Days

Thursday saw the market gap up but reverse and close lower. Friday we had the opposite occur, with SPY gapping down but closing higher. It also closed at a new high on Friday, which triggered the study below.

2014-09-08 image1

The numbers here are somewhat bearish, with much of the damage being done by day 2. Traders may want to give this study some consideration when evaluating the market’s prospects over the next day or two.


Want research like this delivered directly to your inbox on a timely basis? Sign up for the Quantifiable Edges Email List.

Does Wednesday’s Big NDX Drop Hurt The Bull Case?

One interesting aspect of Wednesday’s action was that the NDX suffered its worst decline in at least 20 days while SPX made a 20-day intraday high. This is something I’ve looked at for subscribers in the past, but never shown on the blog. When I previously examined other instances I found little in terms of short-term implications, but the intermediate-term implications appeared strong. Below are updated results.

2014-09-04 image1

Results here appear pretty strong throughout. The big NDX drop during an intermediate-term move higher for SPX has rarely derailed the rally. Most of the time it has been followed by additional gains.


Want research like this delivered directly to your inbox on a timely basis? Sign up for the Quantifiable Edges Email List.

Labor Day Week When The Market Has Been Strong

In past years I have shown that Labor Day week performance has often been poor when the market has rallied over the month (20 trading days) leading up to it. Below is a look at Labor Day week performance when the previous 4-week period has seen gains.

2014-09-02 image1

This shows the poor performance record when there has been a rise in the market. Below is a look at the profit curve using a 4-day exit strategy.

2014-09-02 image2

Definitely choppy. And the last couple of instances have seen gains during the week of Labor Day. But the overall downslope and evidence still has believing it is worth some consideration. (A strongly bullish performance this year could change my mind for the future, though.)


Want research like this delivered directly to your inbox on a timely basis? Sign up for the Quantifiable Edges Email List.

Performance After 2 Unfilled Up Gaps & A 50-Day High

One interesting aspect of Tuesday’s action is the SPY gapped up above Monday’s close, and never filled that gap. This made the 2nd day in a row with an unfilled up gap. The study below is one I’ve shown before in the subscriber letter. It examined other times SPY left 2 unfilled up gaps and closed at a 50-day high. All stats are updated.

2014-08-27 image1

The size of the follow-through isn’t terribly large, but it has been very consistent that some follow through was achieved in the next few days.


Want research like this delivered directly to your inbox on a timely basis? Sign up for the Quantifiable Edges Email List.

A New SPX High With A Rising VIX To Start The Week

While the SPX closed up the VIX also rose. Most often they trade opposite each other, so this kind of action is somewhat unusual. But VIX has a tendency to decline going into the weekend (Friday afternoons), and then rise when it returns from the weekend. So to see this action on the first trading day of the week is less unusual than at any other time. Still, combined with the SPX 50-day high, it has been often followed by a dip in the next few days. This can be seen in the study below, which I last showed on the blog in May. Results are all updated.

2014-08-26 image1

Results here appear squarely bearish for the 1-2 day time period. Traders may want to keep this in mind for the next couple of days.


Want research like this delivered directly to your inbox on a timely basis? Sign up for the Quantifiable Edges Email List.

Performance After Fast Moves From A 50-Day Low To A 50-Day High For SPX

One amazing fact about the current rally is that Thursday’s 50-day high close came just 2 weeks after SPX closed at a 50-day low. That’s quite rare to see. The last time we saw a move from a 50-day low to a 50-day high occur so quickly was in October of 2011. The study below was originally published in the 10/17/11 letter and it examines such sharp moves. All stats are updated.

2014-08-22 image1

There have only been 6 occurrences but the stats are overwhelmingly bullish over the next month. For those interested in exploring further, the dates were 8/1/61, 6/17/76, 8/20/82, 8/2/84, 6/24/98, and 10/14/11. Also notable but not shown in the stats above is that the average run-up of the 6 instances (5.4%) is over 5x the size of the average drawdown (1.0%) over the 1st 17 days. And every instance saw a run-up of at least 2x its drawdown.  Despite the low number of instances this study may be worth some consideration.


Want research like this delivered directly to your inbox on a timely basis? Sign up for the Quantifiable Edges Email List.

SPX Performance After A Persistently Oversold VXO

Friday we again saw the VIX and VXO (the old calculation for the VIX) close well below their recent mean. Such stretches suggest a collapse in fear among investors. The study below was last seen in the 2/13/14 blog. It looks for stretches in VXO of 15% or more below the 10-day moving average that have persisted for three days.

2014-08-18 image1

Based on the stats table there appears to be a short-term  downside inclination. I find the note at the bottom of the study to be especially interesting. Nearly every case has experienced an almost immediate pullback, but those that didn’t went without pulling back for a long time.


Want research like this delivered directly to your inbox on a timely basis? Sign up for the Quantifiable Edges Email List.

When VIX Quickly Moves From Overbought To Oversold

After a few strong days you will often find some bearish studies appearing. But the Quantifinder provided no bearish evidence yesterday afternoon. Just the bullish one below. It considers the sharp drop in the VIX over the last couple of days after a sharp rise the previous few.

2014-08-14 image1

The market condition that would typically accompany such VIX movement is one where you see SPX undergo a strong rebound from a sharp decline during a long-term uptrend, which is what we are currently looking at. Results over the first 2-3 days are not terribly consistent, but once you get out beyond that the bounce becomes more reliable and more powerful.


Want research like this delivered directly to your inbox on a timely basis? Sign up for the Quantifiable Edges Email List.