One amazing fact about the current rally is that Thursday’s 50-day high close came just 2 weeks after SPX closed at a 50-day low. That’s quite rare to see. The last time we saw a move from a 50-day low to a 50-day high occur so quickly was in October of 2011. The study below was originally published in the 10/17/11 letter and it examines such sharp moves. All stats are updated.
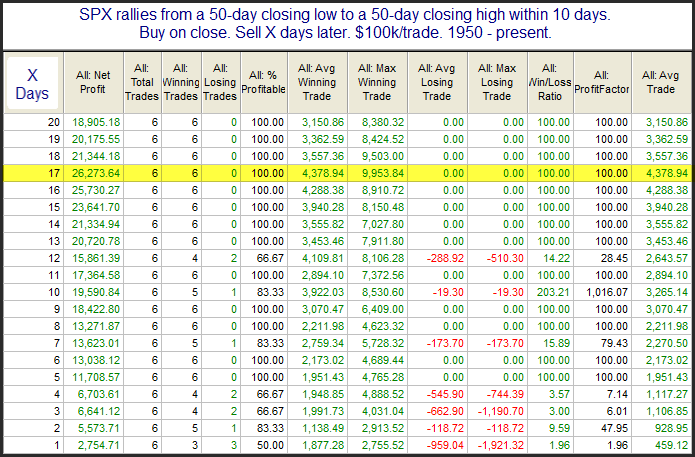
There have only been 6 occurrences but the stats are overwhelmingly bullish over the next month. For those interested in exploring further, the dates were 8/1/61, 6/17/76, 8/20/82, 8/2/84, 6/24/98, and 10/14/11. Also notable but not shown in the stats above is that the average run-up of the 6 instances (5.4%) is over 5x the size of the average drawdown (1.0%) over the 1st 17 days. And every instance saw a run-up of at least 2x its drawdown. Despite the low number of instances this study may be worth some consideration.
Want research like this delivered directly to your inbox on a timely basis? Sign up for the Quantifiable Edges Email List.