After Monday’s Big Effort For A Small Gain
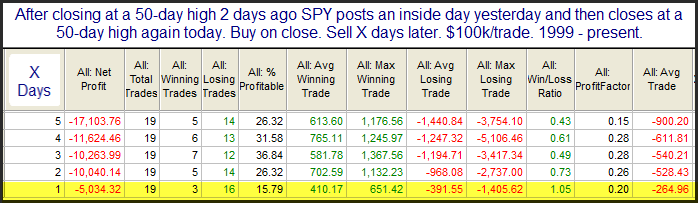
The mild action on Monday did not trigger a whole of studies Monday afternoon but the one below was fairly compelling. It suggests that when SPY closes strong (in the top 10% of its range) but still only manages a small gain on the day, that the next day has a downside tendency.
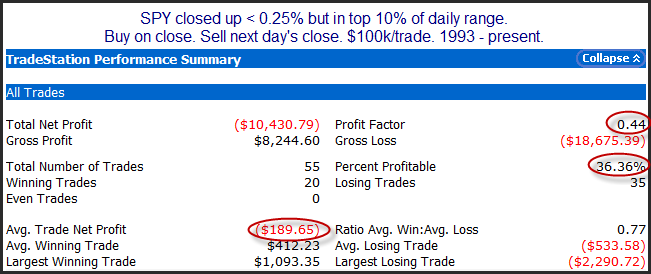
As you can see there appears to be a bit of a bearish inclination. Of course futures are down a lot already, so it will be interesting to see how the day plays out. Will we see additional fear ahead of tomorrow’s Fed announcement, or will the market rebound in anticipation of it?
Want research like this delivered directly to your inbox on a timely basis? Sign up for the Quantifiable Edges Email List.