Over the years I have done a good amount of work quantifying IBD Follow Through Days (FTD). In the 8/24/11 blog I looked at the impact of breadth on FTDs. To compare breadth across market regimes, instead of using absolute breadth readings I use relative breadth readings. The study below uses the 1-yr Up Issues % Rank. This reading compares breadth versus all other days for the last year. Tuesday’s strong breadth placed it in the 99th percentile breadth-wise. This first table below looks at performance following FTDs that came along with an Up Issue % reading that was among the top 5% of all readings over the previous year. All stats are updated.
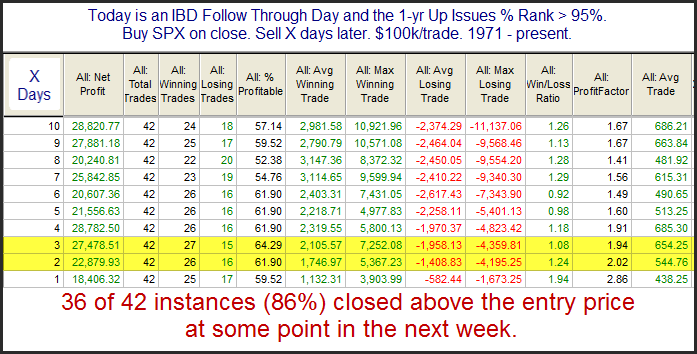
As you can see there appears to be a tendency for the market to continue higher after these strong-breadth FTDs. Now let’s examine performance after FTDs on days that did not show exceptional breadth strength.
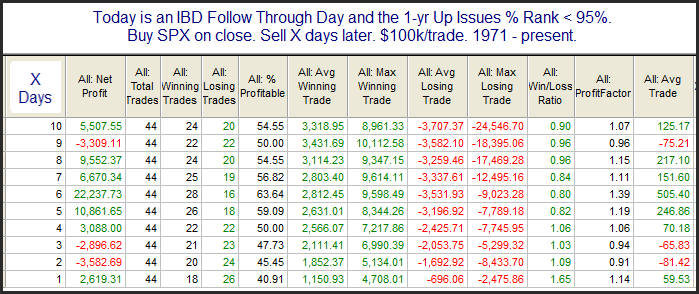
As you can see, there is no discernible short-term edge here. From an intermediate-term perspective, I would also note that breadth seemed to play a part there as well. When the Up Issues % Rank was > 95% then 22 of 42 instances (52%) managed to post successful rallies. When breadth was not as strong on a FTD, then only 19 of 44 instances (43%) went on to successful rallies.
(Note: For purposes of all the FTD tests, a “successful rally” was defined as one that achieved the lesser of 1) twice the distance from the close of the Follow Through Day to the low of the potential bottom day, or 2) a new 200-day high.)
Want research like this delivered directly to your inbox on a timely basis? Sign up for the Quantifiable Edges Email List.