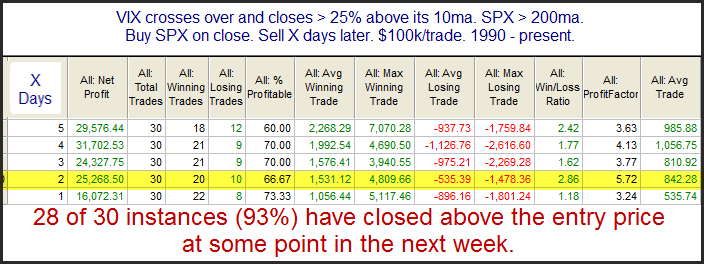
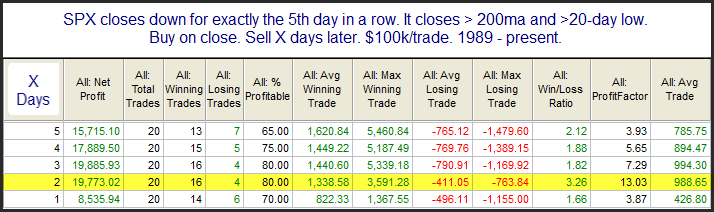
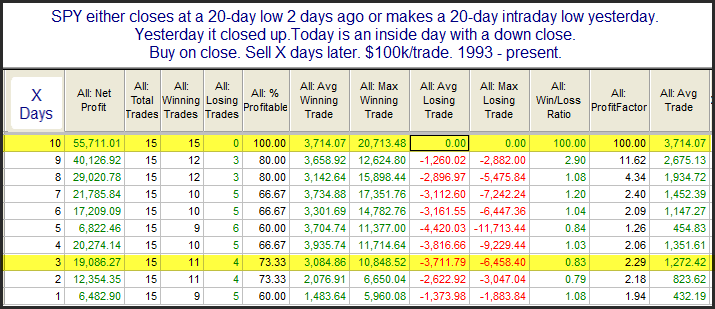
Twenty-Day Lows Ahead of Turnaround Tuesday

Tuesday’s have a well-earned reputation for being days where bounces tend to begin. The study below is from last night’s letter. It was also shown in the Quantifinder yesterday afternoon. It examined other times that the SPX closed at a 20-day low on a Monday. Results have been updated.

2016-10-18 image1

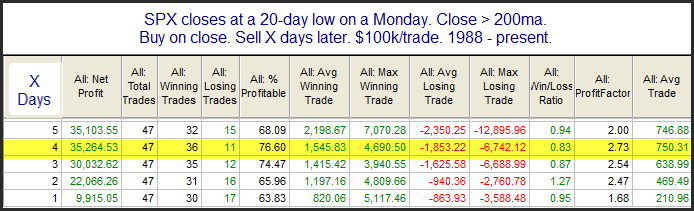
Stats here appear strongly bullish. It is also worth noting that since 2013 there have been 9 winning trades in a row (when looking out 4 days). Traders may want to keep this in mind over the next few days.


Want research like this delivered directly to your inbox on a timely basis? Sign up for the Quantifiable Edges Email List.

October Opex Week Has Historically Been Bullish

From a seasonal standpoint option expiration week is often a pretty good week for the market. October is one of those months where it has been especially good over the years. The study below examines performance during October op-ex week.

2016-10-17 image1

I decided to exclude 2008 because action that week was such an incredible outlier that it greatly skewed all the stats. (The week started with an 11.5% gain on Monday of 2008.) Results 1-4 days out look pretty solid. So the bulls appear to have some seasonal forces on their side this week.
Want research like this delivered directly to your inbox on a timely basis? Sign up for the Quantifiable Edges Email List.

The Weakest Week Is Back

From a seasonality standpoint, there isn’t a more reliable time of the year to have a selloff than this week. In the past I have referred to is as “The Weakest Week”. Since 1961 the week following the 3rd Friday in September has produced the most bearish results of any week. Below is a graphic to show how this upcoming week has played out over time.

2016-09-19 image1

As you can see the bearish tendency has been pretty consistent over the last 55 years. There was a stretch in the late 80’s where there was a series of mild up years. Since 1990 it has been pretty much all downhill. Below is a table showing results of buying Sept. op-ex Friday and then selling X days later from 1990 – 2015.

2016-09-19 image2

The consistency and net results appear quite strong. I note the only instance that didn’t post a lower close at some point during the following week was in 2001. And the 9/11 attacks certainly made for unusual circumstances that year.


Want research like this delivered directly to your inbox on a timely basis? Sign up for the Quantifiable Edges Email List.

Sharp Decline in VXO and the New Market Environment

Yesterday I showed a VIX-related study that suggested it was so stretched to the upside that the market was likely to get a quick bounce. And we certainly got one on Monday. The VIX is a measure of options pricing and is often referred to as a “fear index”. It saw a 13% drop on Monday. Meanwhile, the VXO, which is the old calculation of the VIX declined nearly 23%. Such big declines often suggest short-term over-optimism on the part of traders and are followed by a dip the next day. This can be seen in the study below.

2016-09-13 image1

Numbers here suggest a downside edge for Tuesday. I’ll note that there are some other studies I am seeing that show short-term bullish inclinations. But the way the VIX and VXO are jumping around, we certainly seem to have entered an emotional, reactive market environment. Such environments can be prone to whippy action. Traders should anticipate a market that is much different than the quiet, tight ranges we experienced from mid-July through early September.


Want research like this delivered directly to your inbox on a timely basis? Sign up for the Quantifiable Edges Email List.

What The VIX Spike Is Suggesting For The Next Few Days

Friday’s big drop was accompanied by a big spike in options prices as measured by the VIX. The VIX rose so sharply that it closed Friday 32% above its 10-day moving average. The study below examines stretches of 25% or more, and how the SPX has performed in the following days.

2016-09-12 image1

Very impressive consistency. Sizable bounces seem to have been the norm under these circumstances. There seems to be a decent chance of a bounce in the next few days – and this is not the only study I examined this weekend that is suggesting that.
Want research like this delivered directly to your inbox on a timely basis? Sign up for the Quantifiable Edges Email List.

Tight Consolidations After New Highs

The range over the last week has been extremely tight. On 7/20/16 SPY closed at a 50-day high. Every SPY close in the 5 days since 7/20 has been within the intraday range of that 7/20/16 bar. (And it wasn’t even that big of a range.) It is said that consolidations are often resolved in the direction of the trend. This guideline suggests that we’re more likely to see another leg up from here than a breakdown. The study below tests this concept.

2016-07-28 image1

It certainly appears to confirm the old technical adage. Results favor the long side over the immediate 3-day period and they are even more impressive when looking out 8 to 10 days.


Want research like this delivered directly to your inbox on a timely basis? Sign up for the Quantifiable Edges Email List.

An Extremely Quick Move From A 50-Day Low To A 50-Day High

Remarkable about Friday’s 50-day high close is that it came just 8 trading days after SPX closed at a 50-day low. That’s quite rare to see. The study below is from this weekend’s Quantifiable Edges Subscriber Letter. It looks at all the instances since 1950 of a move from a 50-day closing low to a 50-day closing high that have occurred within 2 weeks.

2016-07-11 image1

There have only been 7 occurrences but the stats are overwhelmingly bullish over the next month. The profit maxes out on day 17 in the table above. To getting a better feel for the instances I have listed them all below along with 17-day stats.

2016-07-11-2 image1

While 7 instances is a bit low, the results are unanimous and the stats above are incredibly lopsided. So it seems this study may be worth some consideration. The average run-up of the 7 instances is over 5x the size of the average drawdown, and every instance saw a run-up substantially larger than its drawdown. That’s impressive.


Want research like this delivered directly to your inbox on a timely basis? Sign up for the Quantifiable Edges Email List.

Intraday Performance After A Massive Gap Down

As I write this in the middle of the night, the S&P 500 futures are down between 4% – 5%. A 4% gap down for the SPY is very rare. Below is a list of all other times it has happened since its inception in 1993.

2016-06-24 image1

It does not appear as though panic selling at the open would be wise. There seems to be a strong upside edge for this one day. Of course the sample size is low and anything could happen in such a highly charged environment.  But this study certainly suggests an upside edge should a 4% gap down actually materialize.


Want research like this delivered directly to your inbox on a timely basis? Sign up for the Quantifiable Edges Email List.

5-Day Declines That Remain Above 20-day lows

(Note – the table below was corrected from an earlier post.)

Wednesday marked the 5th day in a row that SPX closed lower. The study below was noted yesterday afternoon by the Quantifinder. It examines 5 lower closes above the 200ma and also above a 20-day low. All results are updated.

2016-06-16 image1

Based on the stats table there appears to be a bullish inclination, especially over the first 2-3 days. I have actually seen a large number of studies the last couple of days suggesting a bounce is likely. To this point those studies have not mattered. At some point they will, but the market environment appears a bit more dangerous than usual. Still, from what I am seeing, there certainly appears to be a strong chance at a bounce in the coming days.

 
Want research like this delivered directly to your inbox on a timely basis? Sign up for the Quantifiable Edges Email List.

Sharp Drops From Intermediate-Term Highs – A Short Term Bullish Setup

Thursday and Friday saw relatively large selloffs in SPX. After closing at a 50-day high on Wednesday it closed at a 10-day low on Friday. This triggered an interesting study from the Quantifinder that looked at relatively sharp selloffs that made at least 8-day lows. I have updated that study below.

2016-06-13 image1

The stats all suggest an upside edge over the next 1-5 days. Traders may want to keep this in mind when setting their trading bias this week.


Want research like this delivered directly to your inbox on a timely basis? Sign up for the Quantifiable Edges Email List.

A Long Term Look At Memorial Week Seasonality

The week of Memorial Day has shown some interesting seasonal tendencies over the years. And for a long time it exhibited consistent bullishness. But it has faltered greatly the last several years. The chart below examines SPX performance from the Friday before Memorial Day to the Friday after it.

2016-05-30 image1

There was no substantial edge apparent throughout the 70s, but starting in 1983 through 2009 there was a bullish tendency. The last 6 years this week has mostly struggled. So I am not sure Memorial week will provide any substantial edge, but I thought the history was interesting.


Want research like this delivered directly to your inbox on a timely basis? Sign up for the Quantifiable Edges Email List.

When SPX Closes Down Slightly & Remains Strongly Overbought

The move higher earlier this week pushed many oscillators strongly overbought short-term. With such a small SPX decline on Thursday, it is still very overbought as measured by the 2-day RSI. The 2-day RSI is a very sensitive indicator so it would take a very small decline from a very overbought position in order for it to remain above 90 on a down day. This is what happened on Thursday.

2016-05-27 image1

The stats here are all appealing over the 1-2 day period. Winning %, win/loss ratio, and profit factor all strongly favor the bulls. When an overbought market has pulled back as little as it did Thursday, it may not want to pullback at all, and has often continued higher over the next 1 to 2 days.


Want research like this delivered directly to your inbox on a timely basis? Sign up for the Quantifiable Edges Email List.

How Monday’s Consolidation Favors The Bulls

Monday marked the 6th day in a row that SPX reversed direction on a closing basis. Friday’s bounce off a 20-day low on Thursday did not get any follow through. But bulls should not be too discouraged by this. The study below is from the Quantifinder. It considers similar situations in the past.

2016-05-24 image1

The stats certainly appear bullish and the edge seems to occur both right off the bat and after a couple of weeks. Traders may want to keep this in mind over the next few days.


Want research like this delivered directly to your inbox on a timely basis? Sign up for the Quantifiable Edges Email List.

Why May’s Strong Start May Reverse

Yesterday I showed the strong seasonal tendency of the SPX on the 1st trading day of May. Today is a look at what has happened after a positive start to May…

2016-05-03 image1

Of the 19 instances that rose on the first day in May since 1987, 15 of them closed lower 4 days later. The market got a little bit of a head start downward this morning. I’ll also note I am seeing mixed indications, with some bullish evidence as well. So it will be interesting to see how things play out over the next few days. But seasonality is certainly pointing lower.


Want research like this delivered directly to your inbox on a timely basis? Sign up for the Quantifiable Edges Email List.