
From a seasonality standpoint, there isn’t a more reliable time of the year to have a selloff than this week. In the past I have referred to is as “The Weakest Week”. Since 1961 the week following the 3rd Friday in September has produced the most bearish results of any week. Below is a graphic to show how this upcoming week has played out over time.
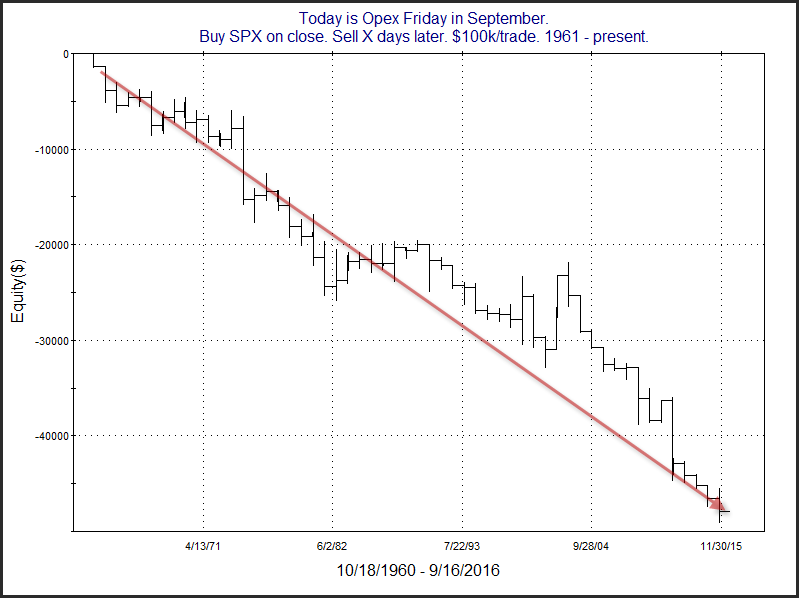
As you can see the bearish tendency has been pretty consistent over the last 55 years. There was a stretch in the late 80’s where there was a series of mild up years. Since 1990 it has been pretty much all downhill. Below is a table showing results of buying Sept. op-ex Friday and then selling X days later from 1990 – 2015.
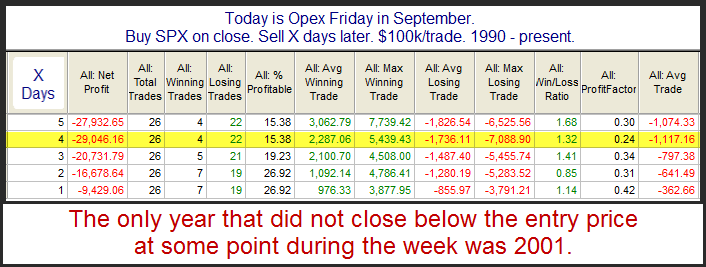
The consistency and net results appear quite strong. I note the only instance that didn’t post a lower close at some point during the following week was in 2001. And the 9/11 attacks certainly made for unusual circumstances that year.
Want research like this delivered directly to your inbox on a timely basis? Sign up for the Quantifiable Edges Email List.
