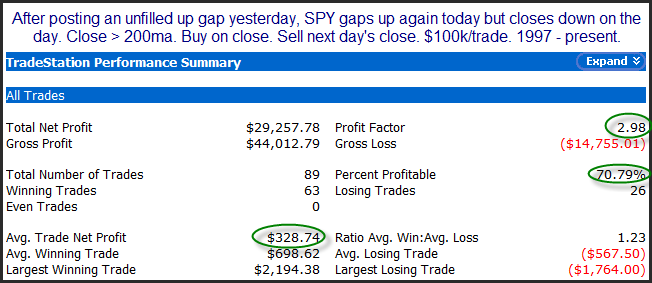
The study below simply examines action similar to the last 2 days with regards to how SPY gapped and finished.
Related Quantifiable Edges Studies
- Unfilled SPY Gap Up + Close Above Open After Oversold: Bullish Edge
- Breakaway Gaps: Unfilled SPY Gap on a 50-Day High Breakout
- Two Unfilled SPY Up Gaps and a 50-Day High: 2019 Updated Study
- SPY Gap Down with Partial Fill: A Short-Term Bullish Setup
The numbers here all look solidly bullish. Traders may want to keep this in mind for today and the future.
Want research like this delivered directly to your inbox on a timely basis? Sign up for the Quantifiable Edges Email List.