Pullbacks Heading Into Opex Week

Opex week often carries some bullish seasonality. Pullbacks into strong seasonal periods will often offer substantial edges. The study below utilizes this concept and examines pullbacks of at least 3 days just prior to opex week.

2018-08-12-1

Numbers here are strong, and suggest a possible upside edge. Of course, August opex week has NOT been great. (Click here to see opex week broken down by month.) So that generates the question of whether the above study would be effective in August. Below are the instances that have previously occurred during August.

2018-08-12-2

There are only 3 instances, so you cannot draw any solid conclusions. But they do not suggest that August offers any kind of problem for the 1st study.

Traders may want to keep this information in mind as they consider their market bias over the next couple of days.


Want research like this delivered directly to your inbox on a timely basis? Sign up for the Quantifiable Edges Email List.

NDX Leader Performance Over Several Weeks After Large Gaps Down (FB Follow-Up)

This is a follow-up from my FB post last night. Traders that looked to take advantage of a possible bounce from today’s open have seen moderate gains so far today. So what are the chances FB continues to bounce over the next several days and weeks? I re-looked at the study from last night, and examined how the other 9 instances performed over the next month.

2018-07-26-5

The chances for a continued bounce do not appear very good. Based on the small sample of 9 instances, gains for the next month actually topped out by the end of the entry date. You can see total gains and most stats above are strongest by simply selling the 1st bar. Of course these results should be taken with a grain of salt, since they were generated on a small sample size, in a different market, and in different stocks. But this one admittedly narrow view is not encouraging. And while it is not enough information to make a trade decision on, I thought traders would find it interesting.


Note: Tests were run on Amibroker using Norgate data.


Want research like this delivered directly to your inbox on a timely basis? Sign up for the Quantifiable Edges Email List.

A Look At Past NDX Leaders That Gapped Down Big (For FB Traders)

After the market close on Wednesday, Facebook (FB) released earnings, and the news and future outlook was not viewed well. After closing at an all-time high on Wednesday, it traded down in excess of 25% in the after-hours. So it seems certain it will be opening Thursday with a sizable gap lower. I decided to take a look back at other leading NDX stocks that suffered large gaps down. I first checked for all stocks that:

  1. Closed at a 252-day (1-year) high yesterday
  2. Were a NDX constituent at the time
  3. Opened over 15% below yesterday’s close

Looking back to 1993, I found only 2 examples. They are shown below with results of buying at the open and selling the close the same day as the gap down.

2018-07-26-1

Amazingly, there have been only 2 instances in the last 25 years. Both saw sizable intraday bounces. Loosening the criteria to require only a 10% gap down yielded the following results.

2018-07-26-2

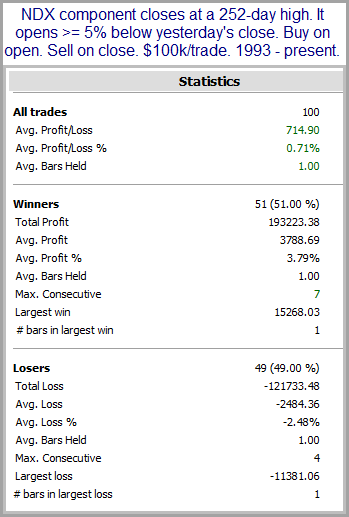
Most of the gains here were thanks to the COMS and VRTX trades from above. I also decided loosen the criteria further and require just a 5% gap down from a 1-year high. Below is a results summary.
2018-07-26-3

Exactly 100 instances and about even as to whether the stock bounced or sold off further. But winners outweighed losers by a sizable amount, making for strong net gains for the study.

Lastly, I went back to the 15% gap down requirement, but I loosened the other criteria so that a stock simply had to close above its 250-day moving average and within 5% of its 252-day high. Those instances are all listed below.

2018-07-26-4

It appears the overall tendency when a leading NDX stock gaps down a sizable amount from a high area is for the stock to rebound some between the open and the close. But volatility and variance is very high. Traders need to decide whether the upside edge and the potential reward are worth the risk when considering trades in FB on Thursday.

Note: Tests were run on Amibroker using Norgate data.


Want research like this delivered directly to your inbox on a timely basis? Sign up for the Quantifiable Edges Email List.

Quantifiable Edges Big Time Swing System Posts Moderate Gain For 1st Half Of 2018

Despite a difficult trading environment in the 1st half of 2018, the Quantifiable Edges Big Time Swing System has managed to continue its winning ways utilizing SPY signals. I’ve updated the Quantifiable Edges Big Time Swing System overview page with results through 7/6/2018. The system only averages about 1 trade per month, so I generally only update it on a semi-annual basis. Through 7/6, there were only 4 trades triggered for SPY. Two of them closed positive and two down for a net gain of about 1.0% (including dividends, commissions of $0.01/share, and an assumed interest rate on cash of 0.1%). While that is well off the average pace for the system, it is nice to see it continue to make new highs even when it underperforms its norms. The QE Big Time Swing System has yet to post a losing year in SPY.

The system provides easy to follow mechanical rules, with no black box component. The standard parameters are not optimized, and have never been changed since the system’s release in 2009. There are only about 11 trades per year averaging 7 trading days per trade. To make it even easier, all entries and exits are either at the open or the close. And to be sure you have everything set up properly, traders may follow the private purchasers-only blog that tracks SPY signals and possible entry/exit levels.

For system developers looking for a system that they can use as a base to build their own system from, the Big Time Swing is an attractive option. It is all open-coded and comes complete with a substantial amount of background historical research. And since it is only in the market about ¼ of the time, it can easily be combined with other systems to provide greater efficiency of capital. Once you’re ready to try and improve the system yourself you can also refer to the system manual or the August 2010 purchaser-only webinar – both of which discuss numerous ideas for customization.

The system has proven its worth since its release over 8 1/2 years ago. Don’t wait another year to determine if the QE Big Time Swing System is appropriate for you. For more information and to see the updated overview sheet, click here.

If you’d like additional information about the system, or have questions, you may email BigTimeSwing @ Quantifiable Edges.com (no spaces).

A look at SOMA changes influence on SPX since Quantitative Tightening began

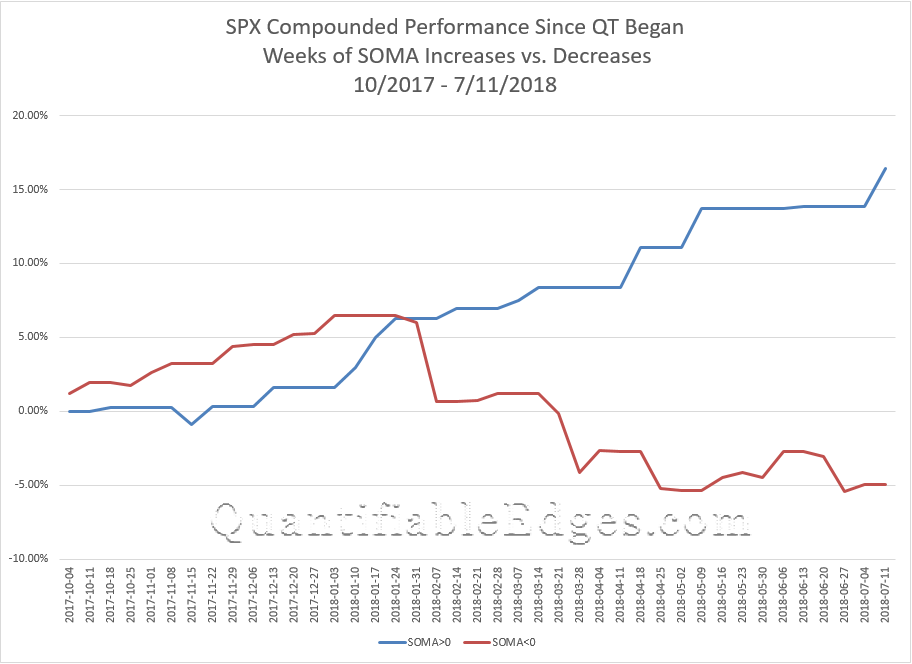
The chart below is from this weekend’s QE subscriber letter. It is one I have updated frequently the last few months. It looks at compound performance of two opposing strategies. The blue line represents a strategy that is invested in the market during weeks that the Fed’s SOMA account value rises. During weeks where the SOMA declines, the blue line is sidelined (earning no interest). The red line takes the opposite approach. It is in the SPX during SOMA contraction weeks, and it is sidelined when the SOMA expands. (The SOMA is the Fed’s System Open Market Account that contains all of its bond holdings.) SOMA changes are released each Thursday, and look at a Thursday – Wednesday reporting week.

2018-07-16

This past week (ending July 11th) saw a mild increase in the SOMA, which appeared to provide just enough opportunity for the bulls to run. Expansion weeks have been positive on a very consistent basis (+16.4% total). Reduction weeks have been choppy and net losers (-4.9% total). The rally this past week again put the blue line at new highs. The last time the SOMA expanded and the blue line did not hit a new high was in November of 2017. The current week (through Wednesday the 18th), I am expecting to see further SOMA increases. But as we close out July and head into August, the Fed’s Quantitative Tightening (QT) program will kick in harder and we should see some sizable SOMA contractions. The expected tight liquidity could make it more difficult for the market to absorb any shocks or bad news. This may open the door for a bearish push, or at least some increased volatility.

For a more detailed discussion of Quantifiable Edges SOMA outlook, you may take a free 7-day trial, where you’ll be able to read this past weekend’s letter as well as next weekend’s.

To learn more about the Fed, its policies, the SOMA, and how it all influences the stock market, check out the free QE research paper, Fed-Based Quantifiable Edges for Stock Market Trading. (This is available with the trial also – no need to sign up for both. Or if you previously registered at Quantifiable Edges, just login, click on “Sub Info” and then look under “Active Resources” to download the paper.)


What 3 Days Of Strong NASDAQ Breadth Suggests For Today

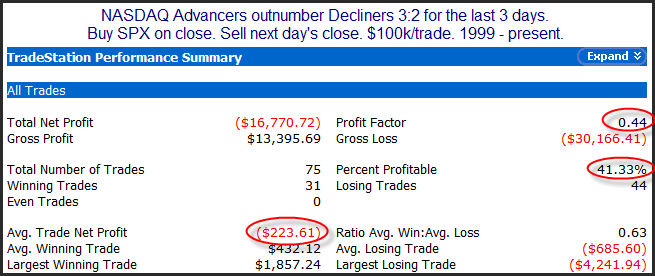
Not only did we see gains for the 3rd day in a row on Monday, but the NASDAQ put in some strong breadth numbers. This triggered a study that looked at times Nasdaq advancers outnumbered decliners by more than 3:2 for 3 days in a row. It suggested such persistent lopsided breadth was about enough, and it was often followed by a down day. Updated results can be seen below.

2018-07-10-1

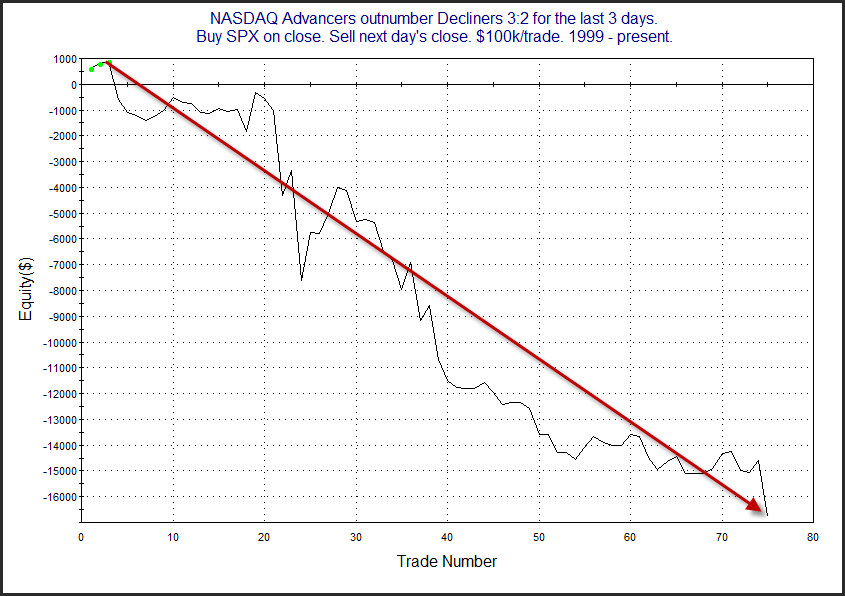
The numbers imply a downside edge. I also included the equity curve (which I normally only do in the subscriber letter).

2018-07-10-2

It’s definitely choppy, but it has moved from upper left to lower right for a long time. And I have shown this study for years, and it continues to make new lows. So I believe it is worth some consideration when establishing my bias for today.


Want research like this delivered directly to your inbox on a timely basis? Sign up for the Quantifiable Edges Email List.
Is Friday’s Sharp Drop in VXO Meaningful?

The rally on Friday was accompanied by a sizable drop in the VIX (and even more so for the VXO, which is the old calculation for the VIX). This triggered some old studies for me in which I noted that big drops in the VXO have had much different connotations depending on whether SPX is in a long-term uptrend or downtrend (as defined by its proximity to the 200ma). I decided to review those studies, which require a 15% 1-day VXO drop, in this weekend’s subscriber letter.

First let’s consider what has followed when the large VXO drop has occurred during a long-term downtrend.

2018-07-09-1

We see here some bearish statistics over the 1-2 day period. There is rarely upside follow-through when fear dissipates that quickly during a downtrend.

But now let’s consider times like the present where SPX is in an uptrend.

2018-07-09-2

Here there is no hint of a short-term bearish inclination. In fact the setup has shown slight gains for each of the time periods measured. I don’t think the numbers are strong enough to consider this a bullish setup, but it certainly is not bearish. When considering short-term implications of strong moves or extreme indicator readings, it often helps to also view things with a long-term perspective.


Want research like this delivered directly to your inbox on a timely basis? Sign up for the Quantifiable Edges Email List.
Wonderful Generosity From Quantifiable Edges Readers

As many readers of this blog are aware, this weekend I will be doing a 150 mile bike ride from Boston, MA around Cape Cod to its tip in Provincetown for the Multiple Sclerosis Society. I have offered anyone that donates any amount of money a copy of the QE Fed Day MS Ride package, which includes a pdf copy of the Quantifiable Edges Guide to Fed Days, along with Fed Day code to allow people to create their own studies. Additionally, you will receive a $25 coupon for Quantifiable Edges products, other than subscriptions. (I just upped the offer to include this.) And if you donate at least $35, I’ll make it a $50 coupon!

To date, Quantifiable Edges readers have donated a total of $815, which I am very thankful for. Last year I was able to raise a bit more, but many donations came in during the Saturday/Sunday ride. I can’t tell you how awesome it was to get off the bike at a rest stop, or in the afternoon when I was completely exhausted and sore, check my email, and see that more people had donated. So I am hopeful that some QE subscribers will surprise me again this year. Donations have ranged from $5 to $100. Thanks to all!

The ride is on Saturday & Sunday, so there is a little more time to get your donations in and take advantage of the Bike MS Fed Day offer!

Here again is the process…

1) Go to my personal fund raising page:
https://main.nationalmssociety.org/goto/scaredrider

2) Make a donation of any size (but feel free to be generous!). Note: The MS donation page makes it look like the min amount is $35. But you can click the “other amount” button on the right and enter whatever amount you feel appropriate. Even small gifts are greatly appreciated!

3) Send an email to support@quantifiableedges.com with your receipt from the MS Society, and by Monday morning you should receive the above Quantifiable Edge Fed Day MS Ride package. (I will try and send it out quicker, but I will not be carrying my laptop on the bike trip!)

And once again, here is what you will receive…
1. The Quantifiable Edges Guide to Fed Days (pdf version)
2. My Tradesation “Fed Day” code that show every Fed Day and the day before from 1982 – 2017.
3. Text file versions of the code in case you do not use Tradesation, but still want the full list of dates, or to translate the code into another program for your own testing.
4. A personal coupon for $25 or $50 off Quantifiable Edges products. (Donations of at least $35 get the $50 coupon.)
Note that the code has only been made available through the MS Ride package. So even if you already have the book – make a donation and get the code!

Thanks for all your support!

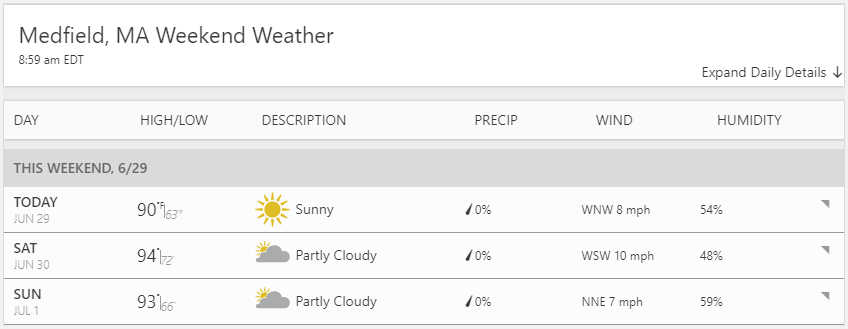
Lastly, I will be tweeting updates during the ride, so you can see how far I am getting throughout the day.  But here is the weekend forecast at this point…
msweather

Gonna be a warm one!

This 2-Day Pattern Suggests the Bulls May Have A Short-Term Edge

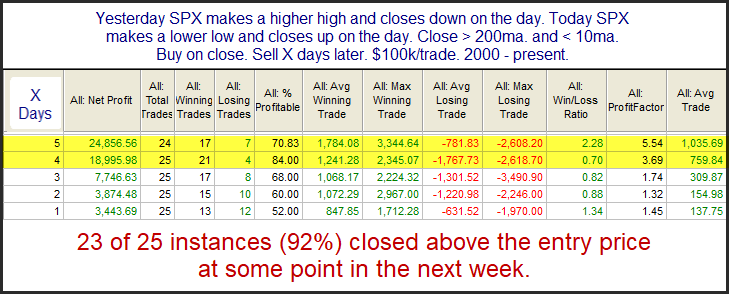
On Wednesday the bulls tried to make a move higher and failed, making for a higher high and a lower close. On Thursday the opposite happened. The bears failed in their attempt at a move lower. A study from the Quantifinder looked at 2-day moves like this. I found results to be substantially different based on whether the market is near the top or the bottom of its short-term range. When the pattern occurs in the lower end of the short-term range is has been consistently bullish over the next 4-5 days. This can be seen in the below test, which is updated.

2018-06-29

Odds strongly favor a move higher and the profit factors are very impressive over the next 4-5 days. The failure of the bears to take control when the market pressed downward and made a lower low on Thursday has opened the door for the bulls.

While not applicable to the current situation, I thought I’d also show the results when the pattern occurred and the SPX closed above the 10ma.

2018-06-29-2

We see here that performance moving forward has been a tossup. Of course we are in the 1st situation. We’ll see if the bulls can keep the momentum over the next 4-5 days.


Want research like this delivered directly to your inbox on a timely basis? Sign up for the Quantifiable Edges Email List.

Follow Quantifiable Edges on Social Media (LinkedIn Just Added)

Quantifiable Edges has recently added LinkedIn to out list of Social Media accounts.  New blogs with links are now posted there as well as StockTwits, Twitter, Facebook, and through our email list.  Below is the full list of QE accounts so you know how to follow Quantifiable Edges anywhere:


LinkedIn – https://www.linkedin.com/company/quantifiable-edges/

StockTwits – https://stocktwits.com/QuantEdges

Twitter – https://twitter.com/QuantEdges

Facebook – https://www.facebook.com/QuantifiableEdges/

RSS Feed – https://feeds.feedburner.com/quantifiableedges/blog

Email List – https://eepurl.com/K3A2r


A couple of notes:

·         The Email List is the one group that may get special offers from time to time, so it is worth following. 

·         Twitter tends to be the most active.  And I will be live tweeting updates this weekend about my progress on the MS Bike Ride.  (Click here to see how to receive research and discounts from QE by donating to the cause.)


VIX Spike Often Followed By Quick Market Bounce

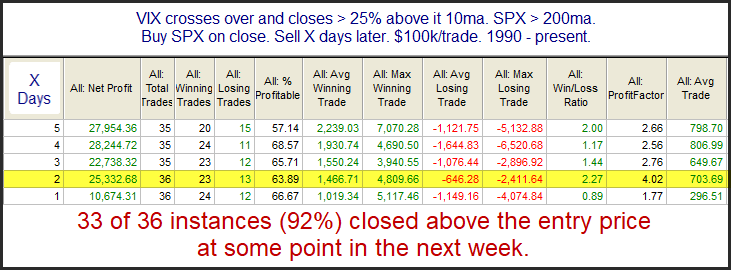
While the SPX declined sharply on Monday, the VIX index rose sharply. In fact, the VIX closed nearly 30% above its 10-day moving average. A stretched VIX is often a sign of an overly fearful market. It will often be followed a strong reversal. The study below is from last night’s Subscriber Letter. It exemplifies this.

2018-06-26

Very impressive consistency. Quick bounces seem to have been the norm under these circumstances. Traders may want to keep this in mind over the next few days.


Want research like this delivered directly to your inbox on a timely basis? Sign up for the Quantifiable Edges Email List.

Weak Week After June Opex

I noted a few years ago here on the blog that the week after June options expiration has done especially poorly in recent years. The table below is updated and shows all such weeks dating back to 1999.

2018-06-18

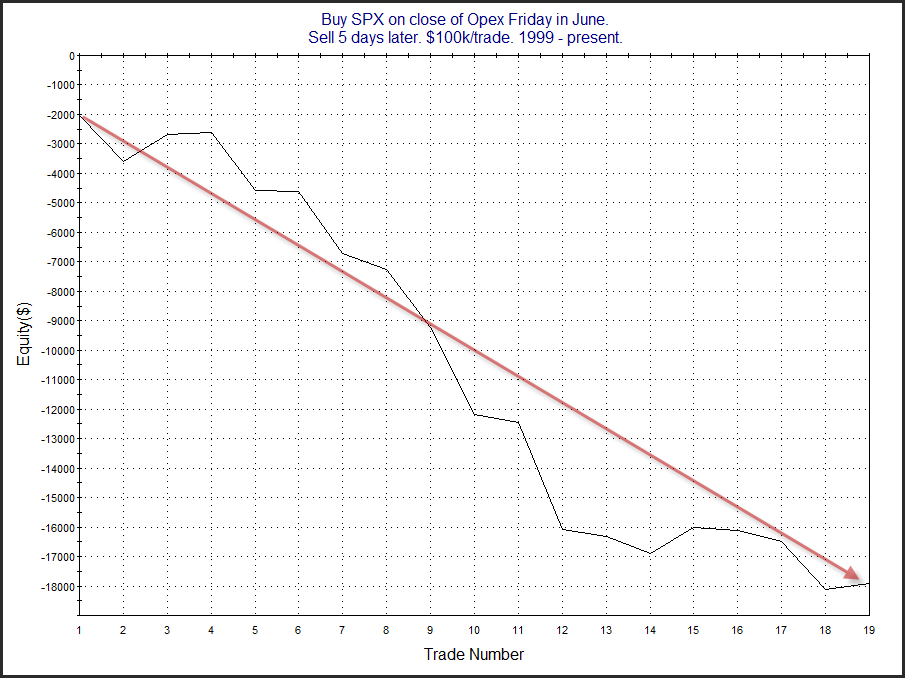
Those are some pretty weak numbers. Below is a 5-day profit curve.

2018-06-18-2

As you can see, it has been quite a streak of bearishness. Twelve out of the last fourteen years have closed down. So it would seem we may be entering a week seasonal period.


I will note that this week has not always exhibited such bearishness. Between 1979 – 1989 this week posted gains every year. (But S&P options, and hence opex week, did not exist until 1984.) Overall, I am viewing it as a mild bearish headwind for the time being.


Want research like this delivered directly to your inbox on a timely basis? Sign up for the Quantifiable Edges Email List.
Short Research Paper on the Influence of Market Direction on Individual Stock Trade Performance

Overall market movement has an influence on the performance of individual stocks.  This is true over both short and long-term timeframes.  For short-term traders, the importance of supportive market movement can be difficult to quantify.  Using Quantifiable Edges long-established stock trading systems and our long-established market timing tool, I demonstrate and quantify the relationship between market movement and system trade probabilities for individual stocks and ETFs.


Quantifying the Importance of Market Direction for Individual Stock & ETF Trades


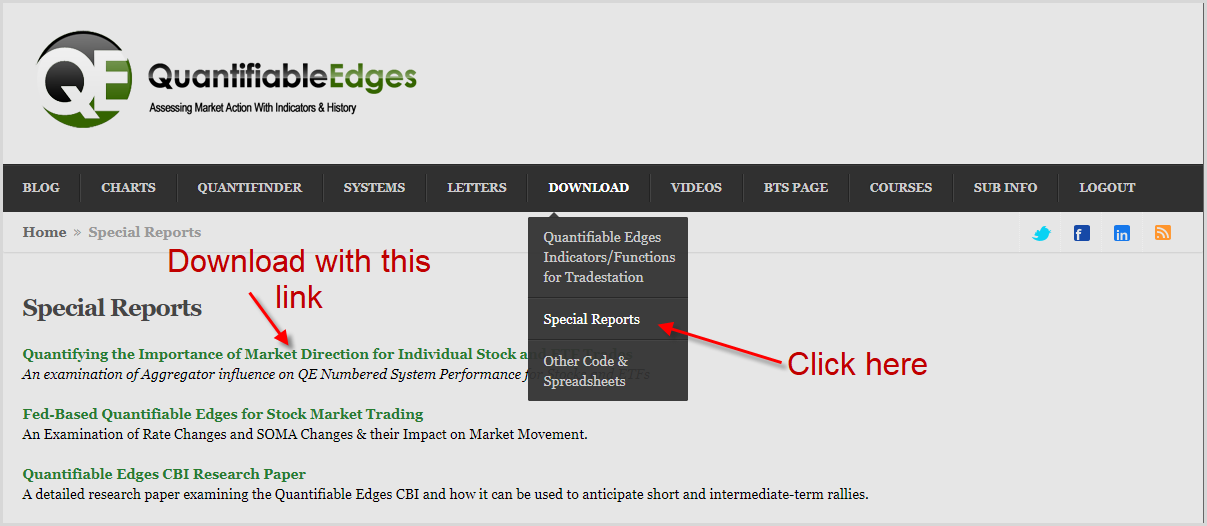
The research paper is available for free download by all registered users at Quantifiable Edges. (Anyone that has ever bought anything or signed up for a free trial or registered for our free downloads. In other words, anyone with a username and login.) If you do NOT qualify, but would like to get a copy of Quantifying the Importance of Market Direction for Individual Stock & ETF Trades, you may sign up for a Free Trial, or register for our Free Downloads.  This will grant you access to all of our other free downloads as well, including the Quantifiable Edges CBI Research Paper, the Fed-Based Quantifiable Edges for Stock Market Trading research paper, and more.


If you already have a username and login at Quantifiable Edges, just login and follow the simple instructions below to download the research paper. I hope you find the research helpful!


2018-06-17


Want research like this delivered directly to your inbox on a timely basis? Sign up for the Quantifiable Edges Email List.
A Down Fed Day After SPX Closed At A 10-Day High

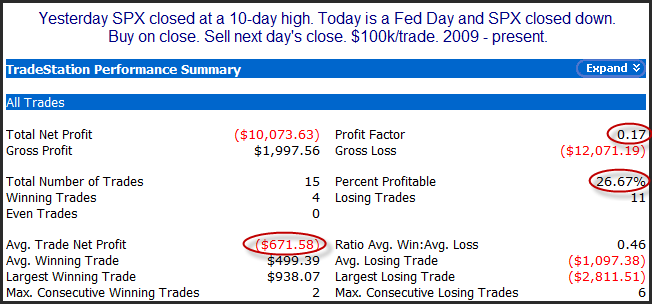
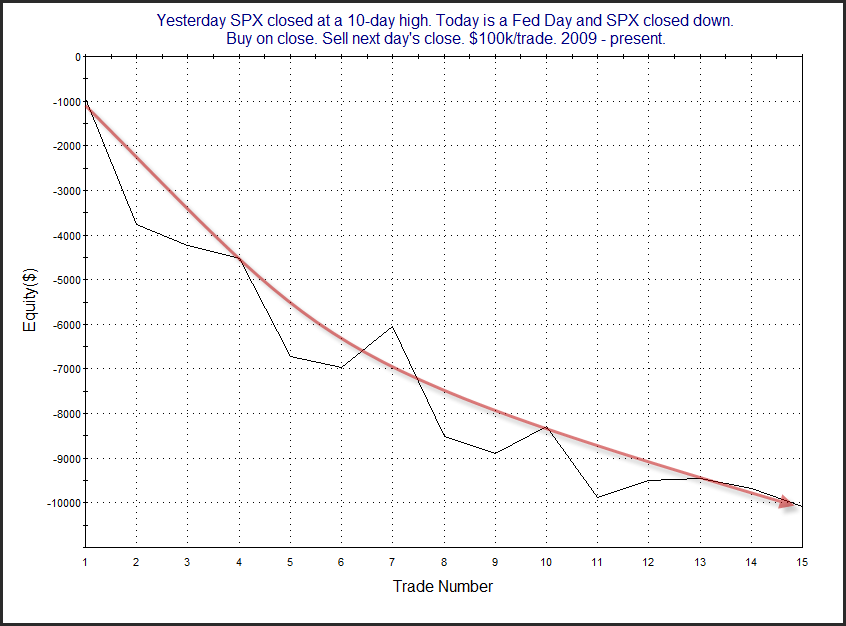
Reaction to the Fed ended up being negative on Wednesday. The study below is an old one I had not examined in a few years. It looked at other times SPX closed down on a Fed after closing at a 10-day high the day before.

2018-06-14-1

This is a setup that has changed over the years. Prior to 2009, this setup often saw the market move higher the next day. But the recent tendency has been decidedly downward. Below is a look at the profit curve.

2018-06-14-2

With a low sample size, and this only being a recent tendency, I do not consider it a strong edge. But this may be something traders want to consider, especially if the tendency persists over the next several instances.


A large number of more substantial edges related to Fed Day activity can be found in the Quantifiable Edges Guide to Fed Days, which is available now if you make any size donation to the Multiple Sclerosis Society. More details on that promotion are available here.


Want research like this delivered directly to your inbox on a timely basis? Sign up for the Quantifiable Edges Email List.

Help Fight MS and Receive Research & More From Quantifiable Edges

Last year Quantifiable Edges readers helped me raise over $4000 for Multiple Sclerosis (MS), and this year I am upping the incentive for people to donate!  I am happy for any size donation, but I have created 2 donation levels this year so that people are incented to give more:


Thank You Level:

One bit of research that Quantifiable Edges has become known for are the many studies I have published on Fed Days. In fact, you could say I wrote the book on Fed Days. And the pdf version of that book sells for $25. But between now and June 30th I will send you a zip file containing the following if you make any size donation to my MS fund raiser page.

  1. The Quantifiable Edges Guide to Fed Days (pdf version)
  2. My Tradesation “Fed Day” code that show every Fed Day and the day before from 1982 – 1/29/2020.  (Updated from last year’s code with the new scheduled Fed meeting dates).
  3. Text file versions of the code in case you do not use Tradesation, but still want the full list of dates, or to translate the code into another program for your own testing.

Note that the code has only been offered with the book as part of the MS fundraiser. So even if you already have the book – make a donation and get the code!  Or if you donated last year, get the updated code!


Big Thank You Level:

Donate $35 or more and you will get everything above and I will also include a coupon good for $50 off any Quantifiable Edges Products, other than recurring subscriptions.  This includes systems, courses, code, or research that Quantifiable Edges has to offer.  (It does not include gold or silver subscriptions.)  And Quantifiable Edges will be coming out with more products later this year.  So even if you already own everything, you can still apply it to future offerings.  The coupon does not expire.  But it can only be used once per person and it will be tied to your email address / QE login.


Why am I doing this?

I really knew nothing about MS until my good friend and former college roommate was diagnosed with it a couple of years ago.  So when he decided to do this ride last year, I joined him.  Having never ridden a bike more than 15 or 20 miles before, it was quite the experience.  Day 1 it rained a lot.   About 11 miles into the 150 mile ride I wiped out on fresh paint on the side of the road, and scraped up my hand and arm pretty good.  Day 2 was scarier, because the staggered start meant less bike traffic, so we had to deal with more car traffic, and on bigger roads.  That was terrifying for me.  Somehow, he talked me into doing this thing again.  So I have 2 goals:


1) Raise more money than last year.  People were very generous last year and I was able to raise $4,034.  This year I am upping the effort.

2) Finish without falling again or injuring myself (beyond the expected sore butt, back, and legs).


I’ll put in the training, endure the pain, and brave the traffic, but I need your help in fundraising efforts!


The Process:

1) Go to my personal fund raising page:

https://main.nationalmssociety.org/goto/scaredrider


2) Make a donation of any size (but feel free to be generous!).  Note: The MS donation page makes it look like the min amount is $35.  But you can click the “other amount” button on the right and enter whatever amount you feel appropriate.  ($35 is the minimum to get the $50 coupon.)  Even small gifts are greatly appreciated!


3) Send an email to support@quantifiableedges.com with your receipt from the MS Society, and within 24 hours we will send you the above Quantifiable Edge Fed Day MS Ride package, (and $50 coupon for those that are eligible). If you don’t receive it in 24 hours, feel free to send us a 2nd email, because that means we likely missed the 1st one, or post a comment below letting us know we somehow missed it!


Thanks for your support and generosity! I hope the Quantifiable Edges Fed Day MS Ride package will pay you back your donation size and much more in your trading accounts!  And I hope together we can make a big positive difference in the fight against MS!


Sign up here to join the Quantifiable Edges Email List.