The rally on Friday was accompanied by a sizable drop in the VIX (and even more so for the VXO, which is the old calculation for the VIX). This triggered some old studies for me in which I noted that big drops in the VXO have had much different connotations depending on whether SPX is in a long-term uptrend or downtrend (as defined by its proximity to the 200ma). I decided to review those studies, which require a 15% 1-day VXO drop, in this weekend’s subscriber letter.
First let’s consider what has followed when the large VXO drop has occurred during a long-term downtrend.
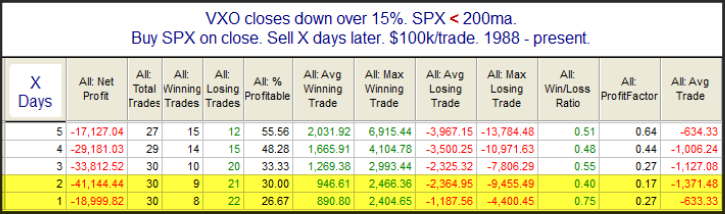
We see here some bearish statistics over the 1-2 day period. There is rarely upside follow-through when fear dissipates that quickly during a downtrend.
But now let’s consider times like the present where SPX is in an uptrend.
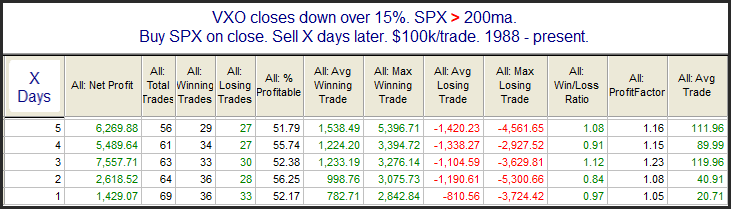
Here there is no hint of a short-term bearish inclination. In fact the setup has shown slight gains for each of the time periods measured. I don’t think the numbers are strong enough to consider this a bullish setup, but it certainly is not bearish. When considering short-term implications of strong moves or extreme indicator readings, it often helps to also view things with a long-term perspective.
Want research like this delivered directly to your inbox on a timely basis? Sign up for the Quantifiable Edges Email List.