What Friday’s VIX Action Hints At

Even with the SPX rising Friday, the VIX managed to close up a bit. The VIX will typically trade in a direction opposite the SPX, so it is unusual that they both close higher. On Fridays, the VIX has a natural tendency to dip in the afternoon, so it is most unusual to see them both close higher on Friday. The study below was last seen in 4/30/12 subscriber letter. It examines other instances of the VIX and SPX both closing higher on a Friday while the SPX is in an uptrending market. All stats are updated.

As you can see, there appears to be a decent downside edge suggested by this study. That edge has primarily played out over the first three days.

When The Fed Sparks A Rally To A Long-Term High

In “The Quantifiable Edges Guide to Fed Days” I discussed Fed Days that close at new highs.  The basic finding was that when the market closed at a short-term high on a Fed Day, then it was likely to pull back over the next few days.  But when it closed at a long-term high, then the rally was likely to continue.  Below is a study from the guide that.  I’ve updated all the stats.

This suggests further upside is likely over the next 1-2 weeks.

The Impact of Intermediate-Term Highs on Fed Day Performance

Tomorrow is a Fed Day. As I have discussed many times, Fed Days generally carry an upside tendency. But this tendency is greatly impacted by certain variables. A large collection of these variables may be found here on the blog under the “Fed Day”label. And many more may be found in the “Quantifiable Edges Guide to Fed Days”.


One variable I showed in January was whether the market was already at an intermediate-term high. There is a decent chance the market closes at a new high today so I’ve decided to update that study.


First, let’s take a look at SPX performance on Fed Days when the SPX has NOT closed at a 20-day high the day before.


That’s basically 30 ½  years of bullishness.


But now let’s see performance at times when the SPX did close at a 20-day high the day before.


No consistency and no pronounced edge in this sample of 37 instances.


Traders looking to play for a short-term Fed Day bump should perhaps be hoping the SPX does not close at a new high today.


Also, for more updated Fed Day research be sure to check out today’s Overnight Overview at Overnight Edges.

A Pattern Of Strength Suggesting More Strength To Come

Short-term strength is often followed by short-term weakness, but when that short-term strength is unusually impressive, it can create a situation where that extreme strength will beget more strength. When the market leaves an unfilled up gap that is considered a sign of strength.  When it does it 2 days in a row and closes at a 50-day high, that can be considered exceptional strength. That is what happened on Friday, and past performance is shown in the study below.

The size of the follow-through isn’t terribly large. But it has been very, very consistent that at least some follow through was achieved in the next few days.

One Strong Short-Term Positive About Thursday’s Breakout

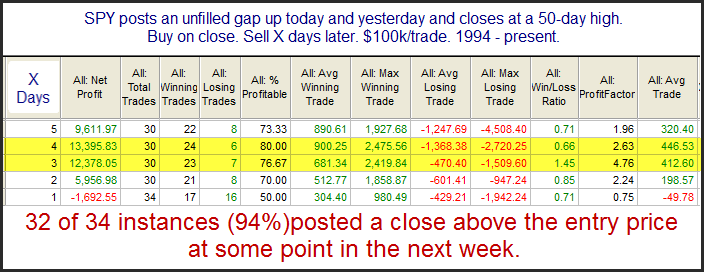
In the 7/19/12 blog I looked at the short-term importance of an unfilled upside gap accompanying a breakout.  With yesterday’s breakout occurring along with an unfilled up gapI have revisited that study below.

Results here are strong across the board.

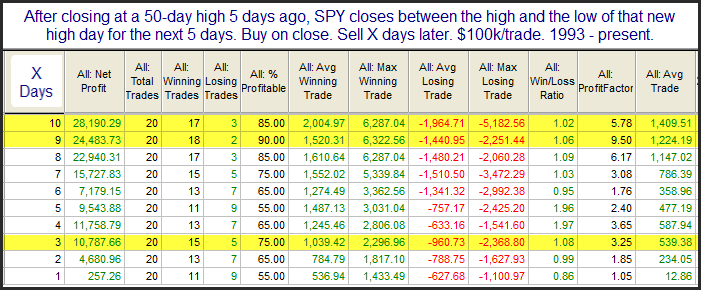
Now let’s look at instances where the 50-day high breakout was not accompanied by an unfilled gap.  Interestingly, the number of instances was nearly the same.  This study also appeared in the 7/19/12 blog and is updated.

As you can see these moves to new highs that don’t start with an unfilled gap are much less reliable over the short-term.

Technicians will often use the term “breakaway gap”.  This suggests the gap occurs on the same day as a base breakout.  The idea is that the new high causes excitement and the gap leaves a good amount of people sidelined or stuck short.  When it doesn’t immediately fill, it leads these people to chase and helps to propel the market even higher.

Interesting Implications of the RUT/SPX Divergence on Tuesday

Last night in the Quantifiable Edges Subscriber Letter I examined short-term implications of strong 1-day rises in the Russell 2000 (RUT) while the S&P 500 (SPX) declined. I found that there appeared to be a decent upside inclination for the following day. This morning I played around with this concept a little further, added a filter that eliminated instances occurring in conjunction with intermediate-term lows, and ran the test out longer. What I found was quite interesting and can be seen in the stats table below.

While 1-day implications appear bullish, looking out over the next couple of weeks there has been a strong downward tendency. This may be worth keeping in mind over the next 10 days or so.

Friday Before Labor Day Seasonally Strong

The Friday before Labor Day has long been a strong seasonal day for the market.  Below is a stats table based on buying the Thursday before Labor Day and selling the close on Friday.

With 71% of the days finishing higher, a profit factor of over 2.5, and an average trade of 0.3% the stats are quite compelling.  Futures are up pretty strong right now, so this one has a head start.  But gold subscribers were alerted to this in yesterday afternoon’s Quantifinder, and Overnight Traders were also made aware of the strong seasonality yesterday afternoon.

Facebook Me!

So it is probably 3 or 4 years beyond when I should have done this, but Quantifiable Edges is finally on Facebook! I’ve set up the page so that all tweets and blogs appear in the timeline.

So for those of you that “like” Quantifiable Edges and would like the tweets and blogs delivered into your newsfeed, you can easily do so.

If you prefer to keep Quantifiable Edges out of your newsfeed, you can still “like” the page and then easily hop over there while in Facebook to check any new activity.

I’m fairly new to all this Facebook stuff, but it seems pretty slick to me, and a nice option for Facebook users to keep up with Quantifiable Edges. I suspect I’ll need to have some kind of “like me” contest soon.

And yes, the new Overnight Edges website is also on Facebook.

You may check out the Quantifiable Edges Facebook page here.

The Overnight Edges Facebook page can be found here.

Mega-Outside Days

Friday was what I call a mega-outside day. It didn’t just make a higher high and a lower low (a regular outside day). It actually opened below the low of Thursday and closed above the high of Thursday. This is unusual, and in the past it has led to a dip over the next few days.

Stats here look strongly negative over the first 1-2 days, with most of the downside occurring on day 1.

The June 12th FTD was a Success

When SPX hit a new high on Tuesday (Aug 21st), doing so deemed the 6/12/12 Follow-Through Day (FTD) “successful” according to the possible definitions of “success” I included in the FTD studies.

Based on a number of the FTD studies, this one bucked the odds.  For one, it came on moderate volume.  Secondly, breadth was unremarkable.  And lastly, it occurred in June.  It was only the 8th FTD to occur in June since 1971 and only the 2nd one to succeed.

Despite all this, the rally went on to new highs.  That’s why I talk about odds and not certainties. This FTD will now be clustered in with the rest and the odds will be recalculated next time one occurs.

When QQQ Posts 2 Outside Days in a Row

Tuesday marked the 2nd day in a row where the QQQ made a lower low and a higher high.  Days that do this are often referred to as “outside days” because they trade outside the range of the previous day.  When QQQ has posted back to back outside days in the past, it has often been followed by a short-term rally.  I last showed this in the 11/10/10 blog.  I posted a link to that blog via Twitter yesterday afternoon.  I have updated the stats table below.

Results still appear strongly positive.

Consistent Closes Near the Top of the Daily Range – And What That Could Fortell

The market has seen a lot of finishes near the top of its daily range lately.  When the market consistently closes near the high of the day it suggests optimism on the part of traders. This end-of-day optimism is now at a level that suggests it is a bit overdone and there is a good chance of a pullback. The study below was last seen in the 7/5/12 blog and it exemplifies this concept. I have updated all of the statistics.

While the downside edge appears to remain in place for a full week, most of the edge has been realized over the 1st 2 days.

Note: To calculate the “8-day Average Closing % Range” I am simply measuring where in the daily range SPY closed each day. For instance if it traded at a low of $141.00 and a high of $142.00 and closed at $141.75, then it would have closed in the 75th percentile of the daily range. A close at $141.50 would have meant 50%.

I then take a simple moving average of the last 8 days. If that average goes from below 75% (where it usually is) to above 75%, the study is triggered.

Quantifiable Edges new baby – Overnight Edges

I can’t tell you how excited I am to announce the launch of Overnight Edges. Overnight trading is something I’ve spent years studying, implementing, and refining.  I’ve kept quiet about it for far too long.  Now I’m finally ready to share it with the world!  I’ll write more on it in the near future, but today I just wanted to formally announce that Overnight Edges is LIVE!  Check it out at