Follow Through Days pt. 3 – Do They Miss Too Much of the Move?

With the Fed meeting tomorrow, another volatile day (after 2:15pm) seems a near certainty. CANSLIM traders will be watchful to see if the Fed can help to produce a Follow Through Day. The S&P 500 is already up over 7% off the lows hit last week. I therefore thought tonight would be a good time to post the 3rd part in my series on IBD Follow Through Days: Do Follow Through Days Frequently Miss Too Much of the Move or do They Signal Early Enough to Capture a Sizable Portion of the Rally?

Should you have missed the first few parts in the study on follow through days you may find them below:

Intro
Part 1 – Are They Predictive?
Part 2 – Does Every Rally Have One?

To determine whether they do a good job of catching a large portion of the rally, I first split all the 1% Follow Through Days into two groups – winners and losers. The test I used was the exact test described in part 1 using 1% Follow Through Days after an 8% market decline. I then measured how far from the bottom the market closed at on the follow through day. I am using the 1% Follow Through Day in this test rather than the 1.7% that IBD currently recommends due to the fact that the 1.7% requirement has had about a 20% chance of missing nearly the entire rally.

Interestingly, when I measured the distance from the low that the Follow Through Day closed, it seemed to have no affect on success or failure. For both winners and losers the average Follow Through Day closed about 5.2% higher than the recent low.

I then decided to examine just the Follow Through Days that worked to see how much the market typically gained on a bull move between December 1971 and now. The average bull move over the period was about 28.8%. This includes some fantastic moves such as the 64% market rise from 10/1990 to 2/1994. Of the 35 “successful” Follow Through Days, 25 (71%) of them saw the market gain at least another 10% before correcting again.

Of course there is no chance of actually selling at the top and capturing the entire remaining portion of the move. If you assume the Follow Through Day gets you into a move 5.2% from the bottom and you will end up or missing out on the top third of the move, then on average each successful Follow Through Day would lead to a gain of nearly 14%.

Using the exit criteria described in Part 1, the average loss on failed Follow Through Day would be about 5.6%

Since 55% of Follow Through Days are “successful”, the expected value of buying the S&P 500 at the close of a follow through day with the above assumptions is ((0.55) * 14%) – ((0.45) * 5.6%) = 5.18%. The nicely positive expected value indicates the Follow Through Day is capable of catching enough of the move to make it worthwhile.

An important point that I neglected in calculating these numbers is that most traders that use Follow Through Days don’t simply trade indices. Stock selection and timing are important components of CANSLIM. Should their stock selection and timing be better than the market on average, then they could see gains many times greater than the expected 5.2%.

So in summary – here’s the good news. If this is a real bull rally there should be plenty of room left to make money even if a big Follow Through Day occurs soon. The bad news is this really isn’t an endorsement of Follow Through Days. It’s more an exercise in risk/reward analysis. And while the 5.2% that’s being given up on average around the market bottom pales in comparison to the potential gains, 5.2% is still more than S&P returned in total in two of the last three years. It’s not a trivial amount. Fortunately, as I’ve demonstrated in the last few weeks, alternate methods can help capture a good portion of that 5.2%. Still, for traders without better methods of identifying market bottoms, the IBD Follow Through Day seems to give a decent chance of capturing a good portion of a rally.

I’ll continue my series on Follow Through Days shortly with my next installment: Do They Work Better After Small or Large Declines?

The Edges Are Dulling

There’s a fair amount of studies outstanding and the market has been putting in a decent bounce, so let’s see where we are at:

First off I found it interesting that the Nasdaq 100 /Russell 2000 Relationship remains disjointed. We are now at 8 days of at least a 1% differential in returns.

Time Stretch Study
This was the first study of the currently active bunch to be posted. The exit on this study was based on a close above the 10-day moving average. The S&P 500 accomplished that today, closing the study. The entry was officially at the close on Friday the 18th. Since I didn’t post it until Sunday the 20th, anyone who may have taken a trade based on this should have gotten a significantly better entry price due to the massive gap down on the 22nd. Even assuming the lousy Friday the 18th entry this study would have been good for about a 2.2% gain.

Capitulative Breadth Indicator
On January 22nd the CBI jumped from 5 to 13. I discussed in detail how moves as high as ten or more have led to strong market bounces in the past. (Click on the “CBI” label at the bottom of this post to see all posts related to this topic.) The standard exit I discussed was exiting when the CBI fell back to 3 or lower. On Thursday I discussed the “profitable 8” exit strategy. This entailed selling on drop in the CBI to 3 or lower or the first profitable close of 8 or lower. This strategy, while consistently profitable, would have shaved about 0.6% per trade off affected trades.

With the drop in the CBI to 5 today I decided to look at a similar exit – selling the first profitable close of 5 or lower or selling when the CBI hit 3. A “profitable 5” exit would have affected only 4 instances. Two of them it hurt the return. The other two it helped the return. The net effect using a “profitable 5” strategy was slightly positive. An exit at today’s close would have netted about 3.3% from the 1/22 entry trigger. If the alternate entry on 1/23 was taken it would be a 1.1% gain. I will continue to update the CBI until it triggers the standard exit reading of 3 or less.

Reversal Bars Studies
The Large Reversal Bar Study which was originally published on the 9th, triggered again on the 23rd. After pulling back below the close of the reversal bar (1/23/08) it has now closed back above it. On the 15th I posted a trade management follow up to the January 9th study. Based on the trade management outlined then, a stop should now be placed below today’s low (1/28).

The Large Bars Down and Up Study is on track so far. That study showed a pullback was likely within the first 5 days following the reversal up (1/23). After that the market was likely to rally – probably after retesting the lows. It’s too soon to draw any real conclusions here, yet.

Summary Thoughts
Oversold conditions are being worked off in most of the outstanding studies. Even with less than ideal entries, profits should be available. Profit taking seems prudent. While certain studies like Reversal Bars and Nasdaq/Russell indicate more upside is likely to come, they also indicate extremely high volatility is likely. Wednesday will almost certainly see volatility with the Fed decision due. There is nothing wrong with letting some profits ride, but I’d suggest traders consider taking at least a portion of their holdings off the table now to protect gains. Preserve capital and wait for a better edge.

Rob Hanna

Does A Disjointed Nasdaq / Russell Relationship Mean Anything?

Below are the returns for the Nasdaq 100 and Russell 2000 for the last 7 days:


The correlation between the Nasdaq 100 and the Russell 2000 in 2007 was about 0.65. Over the last seven days the correlation is -0.14. While it’s a mildly unusual for the correlation of the two to become negative over seven day time spans, it’s not terribly notable. What is notable is something my father-in-law, a very smart and observant trader who is always full of ideas, pointed out to me yesterday. The percent change spread between the two indices has been greater than 1% each of the last seven days. Even days when they are going in the same direction, the disparity between the returns has been large. It’s not because one is clearly outperforming the other. They’ve taken turns having the best/worst performance.

I decided to run some tests to see if I could glean anything from this.

My Russell 2000 data went back to the fall of 1987, so that is how far back I ran the tests. Over the last 20 years I found 10 other instances of 1% or greater divergences of seven days or longer. The most recent occurred in 2001. I then looked to see how the Nasdaq performed over the 20 trading days following an event. The 10 trades are listed in the table below.


With the exception of the 1996 trade, the remaining instances all occurred between 1999 and 2001. The first thing I noticed was that while half the trades occurred during the recent bear market, 9 of the 10 instances led to positive returns over the next 20 days. This would indicate a decent chance of a bullish bias. This is not what really caught my eye though.

What most stood out to me was the size of the returns and the range ((high of 20 days-low of 20 days)/close of day 1) the Nasdaq 100 traded in over the subsequent 20 days. The average winning trade gained 12.8% in the next 20 days. The lone loser lost 18.1%. The average range for the 10 instances was 24.25%, with the smallest range being 14.9% and the largest a whopping 36.5%. Truly eye-catching numbers.

While it’s difficult to draw any concrete conclusions from this study, it appears to me that when major indices diverge this much, something is possibly disjointed in the market. This disjointedness has often corrected itself and led to a multi-week rally. In all cases though, it seems to indicate the market is volatile and is likely to remain that way for a while. This agrees with several of the other studies I have discussed recently. Recall my summary in CBI, Reversal Studies and Bear Market Rallies…

Rob

P.S. Per request, I’ve posted a CBI reading on the top right hand corner of the page. I will update there each day until the reading drops back to 3 or below. I will also update intraday should a significant move be apparent.

CBI Update and Profit Taking Food for Thought

It’s 3pm as I write this. The Capitulative Breadth Indicator CBI will almost certainly drop from 13 to 8 today at the close. In November, which was the last time the CBI had reached 10, I had someone ask me to look at the implications of taking profits a bit quicker. Rather than waiting for the CBI to return to 3, the alternate exit we explored entailed selling on the first profitable close when it dropped to 8 or lower. If the trade remained unprofitable then continue to hold until the CBI returned to 3 before selling. Changing the exit criteria in that way meant early exits on 11 of the 16 trades. In the other 5 trades the CBI dropped from 9 or higher to 3 or lower in one day never allowing the “profitable 8 rule” to take effect.

The net effect of this early exit technique was that profits were reduced on the 11 early exits by about 0.6% per trade. Traders that are nervously sitting on winning positions may want to factor this information into their thinking when deciding whether to take partial or full profits at this point.

The Large Bars Down and Up Study from last night indicated that a pullback was likely within a few days. Whether the pullback comes before or after the CBI hits 3, I don’t know. If you’re sitting on healthy profits and not willing to wait through a pullback of potentially 2%+, then you may want to consider taking at least partial profits. It is not the mathematically optimal exit, but I find sometimes taking partial profits can help alleviate trade anxiety – allowing you to think more clearly and manage the rest of the trade more objectively. If the pullback happens to arrive before the CBI hits 3, then there is also the possibility of adding back to your position at a lower price.

Just some food for thought…

Rob

The CBI, Reversals, and Bear Market Rallies

Quite a day today. For those of you who “missed” the reversal – don’t sweat it. My studies indicate there’s plenty of upside left. Let’s first review and update things we’ve already looked at. Then I’ll show some new stats.

Capitulative Breadth Indicator (CBI)
The CBI remained at 13 today. It normally takes more than one day of buying to significantly reduce the number. The exit signal for this model will come when the CBI closes at 3 or lower. I’ve discussed it in great detail in the last several days. If you missed those posts and want to read up on it, just click the CBI label at the bottom of this post.

Time Stretch Study
Although I didn’t post this study until Sunday night, the study used Friday’s closing price as the presumed entry point. Amazingly, even with an entry as bad a Friday’s close, this study is currently 1% in the black.

Large Reversal Bar Study
The criteria for the reversal bar study on January 9th was the S&P 500 makes a 20-day low and closes greater than 1% higher on increased volume over the previous day. We met those criteria again today. While the Jan. 9th reversal bar ultimately failed, it wasn’t before opportunities for profit, or at least a scratch, made themselves available. Traders may want to go back and review that study and the subsequent trade management follow-up post as they both apply again today.

Large Bars Down and Up
What stood out over the last few days was the volatility and extremely wide range that the market traded in. I did a study looking at these two-bar reversals rather than just looking at the single bar reversal like above. Below are the results: (click table to enlarge)

All of the key stats here look pretty good. An average return of over 3% on a short-term index trade is always eye-catching. I also like the Win/Loss Ratios and Profit Factors (Profit Factor = Gross Profit / Gross Loss). There are fewer trades listed when the trades lasted more than 1 week because the setup occurred again a short time later and I didn’t want to double-count the stats for those instances. I’ve listed all the trades with a 5-day exit below.

A few notable things here:


1) All but one of these trades saw a pullback within the first five days. The lone holdout (9/11/98) pulled back below its entry price intraday on Day 6. Most of the pullbacks were 2% or more. As in the previous reversal bar study, this indicates it is likely unnecessary to chase an entry.


2) All of the instances led to a decent rally at some point beyond the five days shown. Five of the seven groups saw retests before their rallies. These were 10/87, 10/89, 9/98, 4/00, and 7-8/2002. The other two – 10/97 and 9/01 marked the bottom.


3) While the setup has occurred only ten times in the last 30 years, 3 of those times it happened within two weeks of a previous instance. The volatility experienced over the two-day reversal period did not dissipate quickly. This indicates the ride will likely remain a wild one.

Summary
Today was a good start. I believe in the days and perhaps weeks to come there is going to be more volatility and ultimately more upside. While I normally like to stick to the numbers in this blog, logically it makes sense to me that we get some upside here. Here’s my thought process. It seems the whole world is convinced we’re in a bear market. Most of what I see and hear is saying “sell into any rallies”. It is this disbelief which should help fuel to the rise. This may or may not be “the” bottom. If it is, then we will certainly see a nice rally. If it isn’t “the” bottom the rally should still be nice enough to suck in a good number of people before the next serious leg down begins. That’s what bear-market rallies do. They make believers out of suckers then take their money. In either case my studies indicate the rally should be strong enough to grab some profits. Just peek at the trades listed above – several of them were of the Bear Market Rally variety. So have we hit “the” bottom? I have no idea, but I’ll be re-evaluating all along the way.

CBI Closes At 13 – Some Alternate Entry Techniques

The Capitulative Breadth Indicator (CBI) officially closed at 13 this afternoon. The number is now significant.

Some people asked me to look at a few different entry techniques to see how they may have fared over the years. I used SPY instead of the index for these tests so that gaps would be accounted for using stop orders.

The entry techniques tested all looked for confirmation that the market was bouncing rather than simply looking to enter on a spike in the CBI. The exit remained selling on the close when the CBI closed at 3 or lower as I’ve previously described.

The first and second tests looked to buy following a CBI reading of 10 or greater at 1) A move above the prior day’s high or 2) A move above the prior day’s close.

Of these two options, a move above the prior day’s high worked better at avoiding drawdown. Both options saw two of the trades move from winners to losers – though the losses were quite small (0.05% and 0.64%).

The third entry tested looked at buying at the first close that was higher than the previous day’s close (after the CBI hit at least 10). This seemed to work the best (good suggestion Tim). All 16 trades remained positive. The average gain was 2.2%. The maximum drawdown was 4.3% and the average drawdown was only 1.9%. For those who prefer to wait for confirmation rather than scaling in on the way down, a close higher than the previous day’s close seems to have worked quite well in the past.

Today’s action put the market squarely into capitulation territory. The CBI broke 10 as expected. Price is now more stretched and some of the measures I use there (RSI, Bollinger Bands, etc.) are now giving extreme readings. Time was already stretched. I’m expecting a significant multi-day bounce to materialize within the next few days. If it materializes, I expect the most beaten down areas to bounce the most.

Stay tuned…

CBI Spiking – How Bad Can It Get?

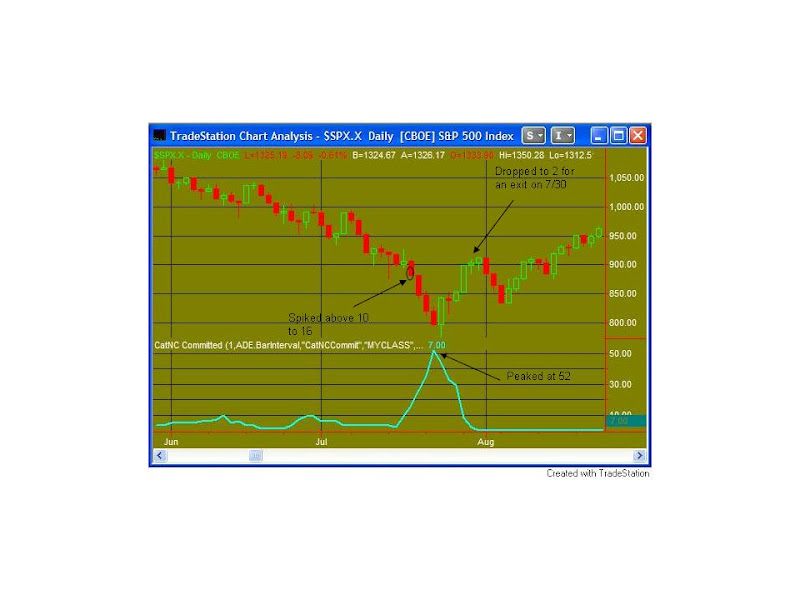
The Capitulative Breadth Indicator is on track to spike up from 5 on Friday to between 12 and 15 today. It has only spiked as high as 15 high 5 other times since 1995. As I’ve stated in the past, spikes above 10 typically lead to a strong bounce. This does NOT preclude more downside before the bounce occurs, though.

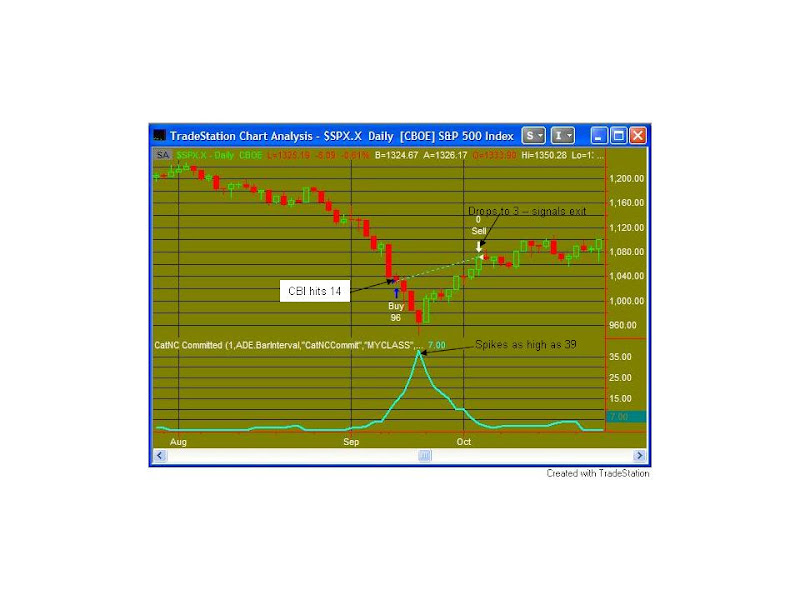
Below are graphical displays of the two biggest spikes (and scariest declines) the indicator has seen. (It was backtested to 1995 and has been measured live since 2005.)

July 2002

In this case there were three more days of selling before the bottom and the bounce came. Going long at the close when it spiked above 10 would have led to a 12% intra-trade decline before posting a 2.4% gain.

September 2001

Here as well there were 3 more days of selling before the bottom was hit. This time the continued drop was about 8.5% from the entry to the low. The gain on the trade in this case was 3.8%.

Summary
The CBI is now signaling a sharp short-term reversal is near. As demonstrated above, there still could be a significant amount of short-term pain yet to endure. Spikes of 10 or higher have happened 16 times. Buying that close and selling on a return to 3 or lower has been profitable all 16 times. The average gain on the 16 occurrences from open to close was about 1.8%. The average intra-trade drawdown was about 3.1%. Starting relatively small and continuing to scale in as the market sinks is my preferred way to play it.

I will continue to update CBI readings in the days ahead.

What stocks will benefit the most when the market bounces?

When the market bounces, what do you want to be buying? Contrary to popular belief, the stocks that held up the best during the selloff, do NOT perform the best on the bounce. In fact, it’s quite the opposite. Below are snapshots of the best (Highest RS) and worst (Lowest RS) performing Dow stocks on a few recent waterfall declines. I show the amount they declined prior to the bottom and then how much they bounced during the course of the initial move off the lows (6-8 days). I also show what the Dow did over the same time period.

In every case, the Lowest RS stocks outperformed the Highest RS by an amount close to or greater than the bounce in the Dow! In other words, a spread trade could have achieved returns close to or better than simply going long the index. Careful, though. A spread trade between the best 5 and worst 5 does NOT eliminate the need for market timing. Typically the least favorable stocks will remain so until the market actually turns. When it does turn, though – look to the most beat up stocks to give the best bounces.

Below are the top 5 and bottom 5 Dow stocks since the swing high of December 26, 2007:

Gap Lower Ahead – Bounce Still Likely?

When I wrote my Time & CBI post last night, I did so with the intention of enjoying my day off and not writing anything tonight. Foreign markets and U.S. futures have helped to ruin my plans. Will the gap down tomorrow morning (should it continue to be in the 4%-5% it looks like now) affect my thinking based on last night’s study?

Not much.

I still think we are getting stretched time-wise. The CBI could really jump by the close tomorrow – I’ll try and update the reading during the day and definitely by tomorrow night. Is it possible the market could fall another 5%, 10%, 15% before bouncing? Sure. The bounce will be fierce, though, and the further we fall before the bounce (and the higher the CBI goes), the more fierce it will likely be. Exact timing is difficult, but I still believe aggressive traders can begin toe-dipping. I believe a tradeable bounce will occur within the next 5-6 days at the most – probably sooner.

As of yet I will make no prediction as to the sustainability of the bounce. I am currently looking at it as a swing trade and not a long-term buying opportunity.

Time & CBI Indicate A Bounce Could Be Near

In Friday’s blog I mentioned it looked like the market was beginning to capitulate, but I didn’t feel it was quite there yet. The study I showed indicated that strong, high-volume, extremely weak breadth declines like we’re seeing are difficult to time. Frequently there was more downside when looking at those conditions. Friday in fact brought about some more downside. While price and volume are still not telling me to dip my toe in, breadth and time are.

My favorite breadth indicator when the market is experiencing strong sellofs is my Capitualtive Breadth Indicator (CBI). On Friday morning I noted the CBI had only hit 3 so far and I would feel better about being aggressive if it was 7 or higher. It poked up to “5” at the close. This is normally the first level where I begin to consider it somewhat significant. Based on the position of stocks in the qualifying list it could easily spike up to 7 or higher on Tuesday and possibly even reach the “10” level by Wednesday. The CBI is not a perfect timing device, as it can be early, but the higher it gets, the stronger the subsequent bounce is likely to be. In an upcoming post I’ll show some worst-case scenarios using the CBI.

Time is beginning to favor the “bounce” argument as well. The move down has been extremely persistent and the major indices have all failed to put in a decent bounce. The closest thing we got was the minor rebound following the large reversal day. While that ultimately failed, it did put in an effort just barely good enough to allow traders to exit with a small win or small loss. Still, the major averages all failed to even poke above their 10day moving average on that bounce.

I took a look at a fairly simple mean-reversion strategy based on the current setup and the results were quite positive. I ran the test back 30 years. Below is the setup:

Condition1 – S&P 500 has failed to post a HIGH above its 10-day simple moving average for at least 12 straight days.

Condition2 – S&P 500 posts its lowest close in at least 12 days.

Buy the S&P 500 on the close. Exit the trade when it closes above its 10-day moving average.

There have been 12 such setups over the last 30 years. Every one of them has been a winner. The average gain was 1.9%. The worst drawdown was about 4% on a closing basis. The average trade lasted a week. The trades are listed below:

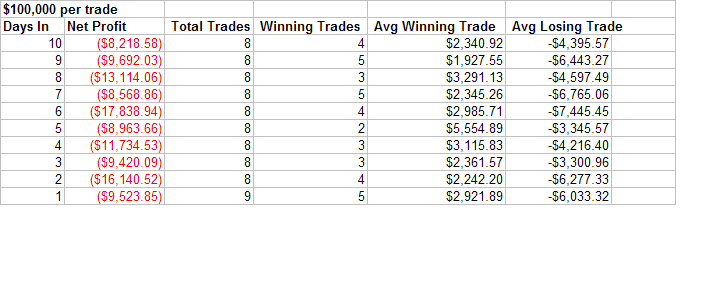
I also ran the same trades with a time exit. Rather than selling on a cross of the 10ma, I simply sold “X” days later. This will help to illustrate the typical type of action:


As you can see, most of the bounces lost steam after about a week. In fact, once you get 3-4 weeks out, losers outnumbered winners and losses were larger than gains. So while this kind of “time stretch” trade has been good for a bounce – that’s normally about it. Outstaying you’re welcome could be hazardous.

Mean reversion trades can be especially difficult in markets like this where price is in a freefall and there is no support nearby and no reasonable place to set a stop. Limiting exposure to control risk is therefore extremely important. And since exact timing is difficult and the market may still have a good amount left to fall, it is imperative that traders have additional capital they can put to work should the setup improve.

To sum up, the time stretch is indicating a bounce is likely coming soon and the rising CBI is indicating the bounce could be sharp. These two factors are providing a quantifiable edge. Aggressive traders could consider adding a small amount of long exposure in anticipation of this bounce.

Rob
P.S. Traders interested in seeing another similar example of a “time stretch” may see the October 11th post from my old blog.

Capitulation Appearing – But Do We Have Further To Go?

Signs are finally showing that the market is beginning to capitualte, at least on a short-term basis. Thursday saw another day where down volume swamped up volume on the NYSE by more than 9:1. Volume spiked. The price drop was over 2.5% in the major indices. The VIX has finally begun to spike. We seem to be in the midst of a waterfall decline. I ran several tests last night looking for indications that a bounce was immenent. I was dissapointed. Below is one example:

S&P 500 hits 50-day low on the largest decline in 50 days and largest volume in 50 days. Breadth is at least 9:1 negative. Hold X days:

The instances found are as follows:

10/16/87 (and 10/19/87), 10/13/89, 10/27/97, 8/4/98, 8/27/98, 5/17/06, 2/27/07, and 7/26/07.

Some pretty scary selloffs among that bunch. I’d suggest traders review their charts to see those dates. As stretched as the market is, and with breadth, volume, and sentiment indicators all spiking a bounce is surely coming soon. Stepping in too early could make for some hairy trading, though. My Capitualtive Breadth Indicator has only reached “3” at this point. While it doesn’t capture every spike lower, I’d be more comfortable getting aggressive if it was at “7” or higher. Nibbling may be ok, but my studies suggest caution is warranted. As I write this in the morning the futures are already bouncing over 1.5%- making for a difficult entry for traders even looking to nibble.

Regards,

Rob

Follow Through Days pt. 2 – Does every rally have one?

According to Investor Business Daily, not all Follow Through Days signal the start of a huge market rally, but no market rally has ever begun without one. Today I am going to put this to the test. For those who missed my first few posts on quantifying the IBD Follow Through Days you may find them here:

1) Do IBD Follow Through Days Provide A Quantifiable Edge? (Intro)
2) IBD Follow Through Days pt. 1 – Are They Predictive?

My first inclination when reading this claim is that it reeks of false bravado. I went to the Celtics game last night. Since the beginning of the franchise, the Celtics have not won every game in which they scored at least four points, but they’ve never won a game without scoring at least four points. And while their franchise winning percentage of 58.7% is better than IBD’s Follow Through Days success rate, I did not feel the game was well in hand when they took a 4-2 lead.

To be fair, scoring 4 points in a basketball game is much less significant then a 1% (or 1.7%) move in the market. Still, I could hardly fathom a market rally that at some point didn’t have an up day of at least 1% on increasing volume.

One difficulty in testing IBD’s claim is that over time they have changed the percent rise required for a follow through day. Whereas it was originally 1%, it now stands at 1.7% (and for a while was 2%). My biggest issue with this is that I was able to find no reasonable explanation for the change. One article cited “changing market conditions”. Increased volatility was another explanation I’ve heard in the past, but that simply doesn’t hold water.

If you take a 50 day moving average of the Hi-Low percentage change in the S&P 500 ((Today’s high – Today’s low) / Yesterday’s Close) you’ll get a current result of about 1.66%. During the period between 2000 and 2002 when the Follow Through Day requirement was increased from its original 1%, the Hi-Low Average was oscillating between 1.2% and 2.3% – around where it is now. Looking back in history, though there were periods where this was low. From 1980-83 for instance, the number was above today’s 1.66% the entire time and reached as high as 3% in December of 1982. If a 1% Follow Through Day was appropriate then based on volatility, it should also be appropriate now.

In William O’Neil’s 2002 edition of “How To Make Money In Stocks” (page 65) I was able to find the following explanation:

“I used to use 1% as the percentage increase for a valid follow-through day. However, in recent years as institutional investors learned of our system, we’ve moved the requirement up to 2% to minimize professionals manipulating a few stocks in the Dow averages to create false or faulty follow-through days.”

No further explanation is given as to why by 1995 his book had sold over 1,000,000 copies but it still took institutions 5 more years to learn of his system and conspire against it. Or why institutions should want to “create false or faulty follow-through days”. What would seem more logical is that the 2000-2003 bear market contained sharp bear-market rallies that created a multitude of false signals. IBD perhaps needed to do something to maintain readership. Changing the Follow Through Day requirement would be one way to handle it. Unfortunately, raising the required percent increase from 1% to 2% at the 2000 top still would have only reduced the number of failures from 7 to 5. After moving the requirement, they never backed off the claim of no bull rally ever occurring without a follow through day.

Since I ruled out increased volatility as a reason for the change and I’m not sure what to make of the institutional conspiracy theory, I decided to test the claim using both the 1% and 1.7% percentage increase measures. Here is what I found:

Using the 1% requirement and looking back to December of 1971, the claim generally seems to hold true. While the Follow Through Day sometimes may have come a bit late and missed a significant portion of the move, there were no bull rallies that I could find that didn’t contain a Follow Through Day at some point.

The 1.7% requirement would have missed or mostly missed several bottoms. Since 1971, these are the ones I found:

August 22, 1973 – The S&P 500 hit a low point of 100.53. Five trading days later (8/29/73) there was a 1.3% Follow Through Day. The market rallied for about two months until 10/26/73. The total gain over the two month span was nearly 11% and the 8/29 Follow Through Day would have caught a decent portion of it. Based on our test as described in Part 1, it was labeled a “success”. Had you waited for a 1.7% Follow Through Day, that didn’t arrive until Day 19. You would have missed out on 49% of the rally and the FTD was a “failure” based on our test criteria since a new high was not made and the FTD failed to deliver gains equal to at least twice the size of the move already made off the bottom before undercutting the rallies lows.

October 30, 1978 – From early September to late October 1978 the S&P 500 lost over 15% from high to low. On December 1st a “1% Follow Through Day” triggered. The market rallied until October of 1979. If you waited for a 1.7% Follow Through Day, that didn’t come until the Dow posted one on 3/27/79. About 5 months and a 12% move after the October bottom.

March 9, 1982 – After a lengthy decline, the S&P 500 hit a low of 106.16 on this day. A 1% Follow Through Day triggered on March 18th that was able to catch a good chunk of the move up to 120.55. The two month market rally was good for a 13.6% rise. If you waited for the 1.7% Follow Through Day on March 22nd you would have missed 46% of the move.

August 4, 1986 – July of 1986 saw a fairly strong selloff. The market bottomed on August 4th after dropping just over 8%. On August 11th a 1% Follow Through Day triggered. The rally was short-lived as the market once again topped out in early September. Before topping out though it did manage to hit new highs. The 1.7% Follow Through Day came on 8/26/86 – the same day the market closed at a new high! Obviously if you’re trying to catch a bottom, you’d like to do it before the market hits a new high.

October 16th 1989 – The market spent about a week scaring people as it dropped over 9% from high to low. On October 19th it posted a 1% follow through day. The 1.7% Follow Through Day didn’t occur until January 2nd. On January 2nd the S&P 500 closed within 1 point of new high. So much for catching the bottom. It then peaked the next day and sold off 11% by the end of the month. Which bring us to the next missed bottom…

January 30th, 1990 – A 1% Follow Through Day triggered on Day 6 of the rally. The S&P 500 rose until mid-July, gaining over 15.5% along the way. The 1.7% Follow Through Day occurred on May 11th – three and a half months into the rally. Waiting for that would have missed 2/3 of the total rally. Below is a chart of the 1989-90 Follow Through Days.
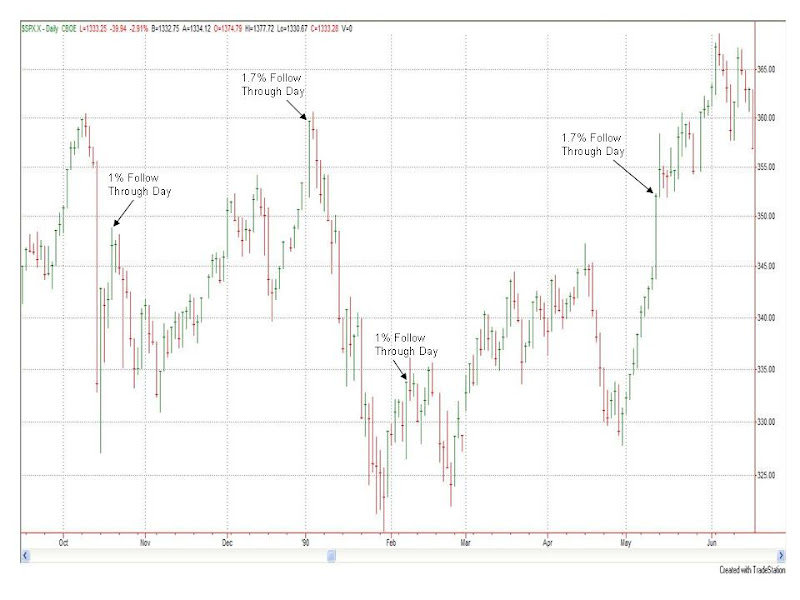
October 28, 1997 – In the fall of 1997 the S&P 500 lost over 13%. On November 13th a 1% Follow Through Day occurred. The market put in a nice long rally. The 1.7% Follow Through Day didn’t trigger until December 1st when the S&P 500 was within 1% of a new high – once again confirming the bottom when we reach a new high.

Summary
If you want to use the IBD Follow Through Day as a technical tool and be sure not to miss a bull rally, then it appears the old 1% increase requirement should be used instead of IBD’s current 1.7% increase requirement. Looking back to 1971, at least 7 bull moves would have been either missed entirely or the FTD would have arrived too late to provide much value. This means over the last 36 years or so the IBD Follow Through Day in its current incarnation would have missed out on about 20% of the total market rallies we identified in this study.

Whether the 1% Follow Through Day consistently comes early enough or whether it misses too much of the move is another question. And it will be the topic of the next part in this series…

Regards,
Rob Hanna

One last quick note – The above should not be taken as a criticism of the IBD method of investing as a whole. The IBD method does not trade indices, but rather individual stocks which meet their CANSLIM criteria. I believe their publications are filled with good ideas. The Follow Through Day may or may not be a good idea. It is the one I am quantifying in this series. So far it has disappointed.

IBD Follow Through Days pt. 1 – follow up & day counts

There has been a good amount of discussion about results of the first part of my study on IBD Follow Through Days. (If you haven’t read it you should do so before reading the rest of this post.) Several readers were concerned whether I was getting the count right.

Unfortunately different IBD and O’Neil sources describe the count slightly differently. This makes exact interpretation difficult.

Fortunately, the exact count method matters very little.

One reader informed me that “24 Essential Lessons for Investment Success” appeared to require an increase in volume on Day 1. Although my IBD sources differed on this point, I tested it anyway. The number of 1% Follow Through Days from 12/1971 until today decreased only from 63 to 62 by adding this requirement. The number of successes dropped from 33 to 31 for a 50% win rate. Results were also nearly unchanged when looking at 1.7% Follow Through Days.

Another reader indicated Day 3 Follow Through Days could qualify under some circumstances. Allowing for Day 3 Follow Through Days, the total number increased from 63 to 70. There were 34 winners and 36 losers. Again – no substantial difference.

The remaining studies will be released using the basic assumptions I outlined in the part 1. Due to inconsistencies with IBD, quantifying Follow Through Days is challenging. As I stated before, just because it is challenging does not mean it is not worth it. I will make my best effort to outline my tests and state my results as clearly as possible.

There are still many more issues to deal with and I will get to all of them. I appreciate the feedback of readers so far, and understand your desire to get it right. I will most likely not look at reader suggested scenarios again until I have completed all six parts of the study along with my summation findings as I detailed in the intro post. Hopefully most questions will be answered by then. I will be happy to deal with any outstanding ones at that point.

Regards,
Rob Hanna

Extremely weak breadth and a possible gap lower…

The IBD Follow Through Day study seems to be generating a lot of interest, and I promise I will get back to it shortly. The market looks to be setting up for some interesting trading tomorrow morning, though – so I thought I’d focus on more pressing issues.

NYSE down volume swamped up volume by over 9:1 today. That kind of breadth is somewhat unusual and can be a sign of panic. Lowry’s was the first group I’m aware of to do extensive study on “90% days” and they have some excellent material on them.


Intel disappointed after the close and has added fuel to the fire.. As I write this around midnight Dow futures are down 100 points, S&P 500 futures are down 12 points and Nasdaq futures are down a whopping 32 points. Asian markets are also taking it on the chin.

Let’s take a look at history to see how the next few days may be setting up. Going back to 1970, there were one hundred and thrity-two 90% downside days identified by my database. When viewing 90% down days in isolation, this is how the next week looked:


As you can see – by itself a 90% down volume day is not a clear sign of a washout. There is more downside to come more often than not.

The next table looks back to early 1993 – the inception of the SPY. Since then there have been thirty-six 90% down volume days on the NYSE. Of those 36, only 5 times has the SPY gapped lower the next morning by more than 0.25%. With a gap lower looking likely, I thought it might be worth taking a look at those occurrences:

The 90% downside day on its own won’t necessarily wash out the market, but when combined with gap down open it typically has served to mark at least a short-term panic low. Although the sample size for this study is smaller than I typically like, should the gap down occur, the consistent and sizable gains in the study above indicate that traders should be aware of a potentially large intraday reversal.

Rob Hanna

Reversal Bar Study Trade Management & Expected Value Concept Discussion

The market put in a nice rally today as all three major indices rose between 1% and 1.6%, but volume was lower eliminating any chance of an IBD Follow Through Day. I’ll get back to my series on IBD Follow Through Days shortly, but tonight I think it’s more important to follow up on my reversal bar study .

One very important element of trading quantifiable edges is trade management. Just because your risk/reward is good going in to a trade doesn’t mean you can just “set it and forget it”. It’s not a Ronco. By continually monitoring trades and following up on studies you can make sure the edges remain with you.

Since the reversal day on Wednesday the 9th the S&P 500 has pulled back and closed below its reversal day close, and then rebounded higher. This is typical of the type of action we observed in our sample set. All of the 16 winning trades discussed with a 14-day holding period pulled back at least 0.5% below the reversal day close before launching higher. So now that we know we are on the right track, it is important to consider what might derail us.

One observation I can make about the winning trades is that it was very rare to see the low of the 1st pullback violated. In fact the only “winning” trade to close below the low of its first pullback was the August 6, 2007 reversal bar. The first pullback off of that reversal was violated on August 14th and the market dropped an additional 4% over the next day and a half before hammering out a panic bottom. While that one was labeled a winner, it would not have been easy to sit through. The only other times the low of the 1st pullback were violated were on an intraday basis. On 12/11/91 the S&P dipped 0.17% below the pullback low before finishing higher. On 11/13/97 there was a 0.34% intraday dip that reversed and also closed higher.

In looking at the 8 losing trades with 14-day holding periods they all saw their 1st pullback eventually fail. More interesting is how they failed. Six of eight of them saw their rebound off the pullback last 2 days or less. In other words – failures happened fast.

This data indicates to me that the low of the 1st pullback can act as an important level. Traders could consider that level to be a reasonable area to place a stop. The winning trades have typically made higher lows from the outset and the losers have failed their 1st pullbacks quickly. Should the S&P 500 close below 1395 or drop much below it on an intraday basis, the setup will cease to be providing a quantifiable edge. When you no longer have a quantifiable edge you no longer have a reason to be in the trade.

The ability to manage and continually re-evaluate the trade as it unfolds is what ensures quantifiable edges remain quantifiable edges. It’s what allows traders to receive better odds than gamblers. The original expected value (gamblers odds) based on the reversal bar study was about a 2.1% return for the 14-bar holding period. (4% * 16/24) + (-1.7% * 8/24) = 2.1%. Even if moving the stop up to around the 1395 level costs us one of the 16 winners, the expected value is still increased to (4% * 15/24) + (-1% * 9/24) = 2.3%. Traders that took the trade on the pullback as suggested should have a substantially better expected value than this since their entry point would be below the 1409 close on 1/9/08. Throw in the fact that the worst-case-scenario for the trade is now only a 1% loss and the trade now looks incredibly favorable. Conservative traders could also take partial profits at this point to ensure they break even / make a small amount / lose only a small amount, on the trade even if they do get stopped out. I’ll talk more about expected value and trade management in future posts since I feel they’re important concepts that traders should make themselves familiar with.

Good trading,
Rob