What The Extremely Low Volume On Monday May Mean

I’m seeing more and more bearish signs. In the Quantifiable Edges Subscriber Letter on Sunday the intermediate-term outlook moved from slightly bullish to slightly bearish. The move was based on recent research, some of which appeared on the blog while some was for subscribers only. Today’s action did nothing to make me feel more bullish.


Let’s take a look at the S&P 500. It rose 1.1% today on the lightest volume since the week between Christmas and New Years. I looked back in history to see how the market performed any time the S&P 500 rose 1% or more on the lightest volume in at least 20 days. Results looking back 30 years below:

As you can see the implications are quite bearish over the next 12 days. One issue when looking at low volume studies, though is holidays. Six of the instances happened on a shortened session near either 4th of July or Thanksgiving. Those were 7/3/1997, 7/3/2000, 11/24/2000, 11/23/2001, 7/5/2002, and 11/23/2007. Two things are notable about these dates: 1) 7/5/2002 was followed by a massive 19% selloff over the next 12 days which skewed the above results negatively. 2) Most of the other holiday instances were followed by rallies which skewed results positively. I re-ran the study excluding these instances. Those results over the last 30 years are listed below:

From a winning percentage standpoint this is quite a bit worse for the bulls. Even eliminating the massive 7/2002 outlier the remaining results have a strong bearish tilt.

For those who would like to read more about the bearish case, check out Bill Luby’s latest chart and some of Dr. Steenbarger’s findings here and here.

A Subscriber Letter Time Stretch System – And Some New Features

Nearly every trade idea tracked in the Quantifiable Edges Subscriber Letter is backed by a fully disclosed historically designed system. The systems all have specific entry and exit criteria and historical risk reward statistics are provided so subscribers can decide whether the trade idea may be appropriate for them. Here is an example from the 5/2/08 letter of a “time stretch” system that was used for gold (GLD):

GLD – buy @ $84.00. GLD has dropped sharply over the last several days. I am looking to buy based on the following criteria: 1)It has closed below its 10-day moving average for at least 10 days. 2) It is above its 200-day moving average. 3) It made its lowest low of the recent selloff today. 4) It closed stretched further below its 10-day moving average than it has on any day of the recent selloff.

Buying the next day at the setup day’s closing price and selling when it closed above the 5-period moving average would have produced the following results over the last 10 years in the list of 109 heavily traded ETF’s I track (most of which have not been around for 10 years):

The setup has only occurred once before in GLD – on June 14th, 2006. It was sold 2 days later for a 3.15% gain.

The trade idea was entered at the open on 5/2/08 @ $83.96. It was closed at the next session’s close (5/5/08) for $86.27 – a 2.75% gain.

Due to feedback from subscribers, I have now begun providing the code for any such system trades to the subscriber base. Tradestation users may import it right into their software for further testing and design.

The 2nd recently added subscriber desired feature is intraday updates. When notable action is occurring in open trades, I may send out Intraday Updates to subscribers alerting them.

If you haven’t trialed the Quantifiable Edges Subscriber Letter yet, just drop a note to QuantEdges@HannaCapital.com and receive three free days. Simply include your name and email address.

Time Stretches

Chris over at Smallcap Slingshot made an observation Wednesday night that the QQQQ hadn’t closed below its 9-day moving average for 15 days. He was curious to see if spending so long on one side of a short-term moving average provided any edge. First I’ll show a test based on his observation then I’ll give my thoughts on this kind of action.

The table below shows the results of shorting anytime the QQQQ closes above it’s 9-day moving average for 15 days in a row, and then holding for “X” number of days. The data goes back to 1999.

As you can see, the results are somewhat choppy.

If instead of holding for a specified number of days, you sell when the QQQQ closes below its 9-day moving average, then your results will improve slightly. Here are the results for QQQQ with this exit strategy:

Trades – 11
Winners – 7
Avg win – 1.8%
Avg Loss – 1.5%
Avg Trade – 0.6%
Profit Factor – 2.1

Not bad, but the low number of trades makes it questionable. Running the same test on the S&P 500 for the last 25 years produces the following results:

Trades – 52
Winners – 31
%Profitable – 59.6%
Avg Win – 0.9%
Avg Loss – 1.0%
Avg Trade – 0.13%
Profit Factor – 1.3

Throw in some commissions and slippage and the positive expectancy of 0.13% is likely close to or at a negative number. On its own, just being above or below a moving average for an extended period provides only a small edge.

Does that mean the ideas should be scrapped? No. In fact, Chris is on to something and his observation is a keen one. Combine a few small edges and you may end up with a substantial one. Some kind of action to trigger an entry when the market is in this extended condition could work quite well.

I’ve referred to these extended periods above or below moving averages in the past as “time stretches”. In January I showed a time stretch technique which worked well in timing the bottom. In that case it was a simple time stretch below a moving average while posting a new closing low. In an upcoming post I may show an example of a time stretch technique from the Quantifiable Edges Subscriber Letter.

Lower Lows

The S&P and Dow have both seen some choppy action over the last week. Each of the last 4 days has been a reversal of the previous day’s direction. Up, down, up, down, up. What’s unusual about the chop is that is has been accompanied by 4 lower lows in the indices (Dow and S&P). In Larry Connors “How Markets Really Work”, he demonstrates that an edge typically exists when the market makes a series of lower lows or higher highs. The edge is in the opposite direction. In the book he also breaks it down by whether the market is trading above or below the 200-day moving average. In my own work I have found the concept of looking at consecutive lows or highs helpful as well.

Let’s look at some statistics based on how the market has performed in the past after a series of at least 4 lower lows. I’ll then offer some opinion on how it translates to our current situation.

A few things to note in the above tables:

The chance of seeing a bounce is greater when you are above the 200ma than when you are below. Over the period tested it’s in the range of 57%-67% above and 44%-60% below. In either case the market is generally more likely to rise over the next 1-10 days.

The average loss is slightly larger when under the 200ma. The difference would be skewed quite a bit more in the favor of the “greater than 200ma” bucket if not for the “max loss” outlier. The unusually large loss above the 200ma came courtesy of the Crash of ’87. (Which incidentally was not included in Connors book since those tests only ran to 1989.)

The average win below the 200ma is nearly twice the size of the average win above the 200ma for most time periods looked at. For those wondering why this is, think “short-covering rally” and increased volatility. Both trademarks of long-term downtrends.

Even with the increased chance of a bounce above the 200ma, the expected value (avg trade) is greater below the line. This would remain true even if you were to eliminate the “worst trade” from the upper bucket.

This study suggests an upside edge over the next few days. Before getting too excited though it may be worth considering what we just learned in the context of the current market situation. Yes, we’ve pulled back 4 days in a row, but although the market is below its 200 day moving average, volatility remains relatively low. The chance of short-covering helping to fuel a bounce seems muted as well since the market has been rallying already for a month and a half. Based on these facts, I would reduce the expected potential reward from the “under 200 ma” level to the “over 200ma level”. The chance of a bounce actually materializing I might put somewhere in between the two buckets. There has been a series of higher lows and the market is in an uptrend, but it isn’t quite a healthy sustained rally just yet.

Overall, I believe the study suggests a positive expectation over the next few days – just not one that is as large as it first might appear when glancing at the tables.

More on Gap Bands

A few nights ago I looked at upside gaps outside of Bollinger Bands for SPY. Tonight I will show them along with downside gaps below Bollinger Bands. I am using the standard 20ma and 2 standard deviations bands for the study. As was pointed out, the band levels are fixed until the close, so the gap criteria is simply a gap beyond yesterday’s closing band. I tested using SPY going back to 7/1/98. I’ll let the table speak for itself tonight.

Equity Put/Call Ratio Spikes Down

Dr. Brett Steenbarger over at Traderfeed has done some excellent work with put/call ratios over the last few years. One way he measures it is by comparing a short-term moving average of put/call volume to a long-term put/call moving average. He has demonstrated numerous times how spikes in the short-term averages over the long-term averages tend occur near market bottoms.

The options market is now experiencing a spike down, rather than a spike up, in the put/call ratio. An example of this could be seen by considering the 5 and 65 day moving averages of the CBOE Equity put/call ratio (two averages that Dr. Steenbarger sometimes uses). As of tonight’s close the 5-day stood at 0.62 and the 65-day at 0.80. This is over a 20% gap from the 65 to the 5.

If spikes up in the put/call can predict a bottom, could a spike down predict a top?

Not based on the limited data available. The equity put/call data has only been tracked back to 2003. Below are the results:

The dates for the 4 instances were 11/10/04, 12/16/04, 5/24/05, and 7/14/05. Basically it happened at times where the market rallied strongly following a pullback or correction. I suspect the sharp drop in the average put/call ratio represents a shift in attitude of market participants. Coming out of a corrective period it appears this buying enthusiasm is a good thing and not representative of complacency.

I also ran the same test using the Total Volume Put/Call Ratio back to 1996. Results there leaned to the bullish side as well with between 57% and 67% of cases showing continued gains over the next 2-3 weeks.

The low put/call ratios may become an issue if they remain low for an extended period. I’d be careful of trying to call a top based on any spikes lower in the ratio, though. Spikes may represent enthusiasm rather than complacency. Now if we could just get some volume we could really make a case for enthusiasm.

Quantifiable Edges Subscriber Letter April Results

I’ve presented below the summary results of the Quantifiable Edges Subscriber Letter trade ideas for April and since inception. April was a decent month. Although there were fewer trade ideas and rewards were a bit smaller than March, it was still strongly positive.

In addition to the trade ideas, the Subscriber Letter provides additional research beyond the blog and shows CBI analysis down to the sector level. More features will be announced soon. Should anyone wish to receive a free three-day trial to the Quantifiable Edges Subscriber Letter, just send an email to QuantEdges@HannaCapital.com and include your name and email address.

A Look At Light Volume

The market pulled back today on light volume. Often heralded as a good thing, readers of this blog understand over the short-term it isn’t.

So I spent some time looking at volume tonight. I’ve been noticing how it has just fallen off a cliff since Easter. I decided to compare the volume the last 30 days to the volume of the previous 50. The last 30 days have posted average daily volume less than 75% of the average of the previous 50. I thought this unusual and did a study to find other times this may have occurred.

Looking back to 1960 I found 10 other instances. Over the next 2-6 months prices rose 7 of ten times. There was also a general decrease in historical volatility 8 of the 10 times. Gains were generally in line with random and 7 for 10 isn’t mathematically significant, so I’m not sure there’s a lot to be learned here. I did find it interesting that all prior instances happened between 1960 and 1980. Dates are listed below:

6/26/61, 8/10/62, 7/26/63, 6/29/66, 2/25/74, 8/25/75, 4/19/76, 7/27/78, 12/13/78, 4/21/80.

If someone sees something I don’t I’d love to hear about it. I did find it interesting that many of the occurrences happened in a generally difficult period for the market but returns were pretty good. For instance, the 70’s had 5 instances – 4 of which led to higher prices over the next two months.

The Gap Band

I received an interesting note from Dr. Steven F. over the weekend who observed the SPY gap open put it above it’s upper Bollinger Band on the gap. For an index to gap open outside of its Bollinger Band, price will almost always need to be somewhat stretched already. It would seem logical that a gap up into an already short-term overbought condition would be a likely candidate for a reversal. I decided to test.

The criteria was simple. A gap up over the upper Bollinger Band would signal a short entry. The trade would be exited near the close of the day. Looking back to 1998 in the SPY I was able to identify 79 such instances. There were 43 (54%) winners and 36 losers. The average winner made 0.56% and the average loser lost 0.50%. The profit factor was a modest 1.34.

I then broke it down by instances above and below the 200-day moving average. Above the 200-day moving average there have been 62 instances of a gap up above the Bollinger Band. Shorting these and covering on the close resulted in 53% winners. Winners outsized losers by 0.57% to 0.38%. The profit factor was a decent 1.7.

The trouble occurred with this less than “Outstanding” Gap Band strategy when it was attempted below the 200-day moving average. There were 17 instances. Ten winners, but the average loss was 1.0% vs. an average gain of 0.5%. Overall a losing strategy below the 200ma.

As with previous gap studies, it appears gaps up in long-term downtrends are dangerous to try and short. While it would’ve worked out on Friday, you always need to be wary of a short-covering rally or trend day up.

Initial results of buying a gap down below the lower Bollinger Band appear better. I will look at them in more detail at a later time.

The 200ma Cross

The Nasdaq 100 led the way today as it rose over 3% and closed decisively above its 200-day moving average. It is the 1st major index to retake the 200-day (the S&P mid-cap 400 also did it today if you consider that one major). Some people believe the 200-day moving average is an important technical measure. Some suggest it’s a somewhat meaningful psychological level. Others see little value in looking at it. Rather than discuss and postulate on the merits of an indicator, I prefer to test it. Let’s see what a cross of the 200-day moving average in the NDX has led to in the past. (Test period is mid 1986 – present.)

Over the period tested the average gain per day in the Nasdaq 100 was just under 0.09% ($90). As you can see, the market seemed to gain steam after crossing the 200-day moving average and strongly outperformed the typical period.

What if we add a filter to eliminate those times where it barely peeked across? I filtered to only look at crosses that finished at least 0.5% above the 200ma. Results below:

These results are even stronger.

How about if we also require that the NDX makes a good-sized move on the day of the cross? I used a 2% gain to test this. More results:

Whatever the reason, a move through the 200-day moving average has provided the NDX some extra fuel in the past. When the move was strong and decisive like Thursday, that made for even better results. A cross above the 200-day moving average isn’t a magic buy signal – but there are worse ones.

Image courtesy of DialBforBlog.

Fed Reaction Not As Ugly As It May Seem

Last night I showed that when the Fed disappoints and the market drops by 1% or more in reaction to it, then the market has generally recovered and worked its way higher over the next couple of weeks.

The Fed disappointed today, although not to the degree we looked at last night. The S&P finished down a relatively mild 0.4%. While the end result wasn’t that poor, the fact that it was up 1% shortly after the announcement and then faded late left many traders with a bad taste. Measuring where in its range the market closed the day is one way to measure the mood near the end of the day. Today the market closed very close to its lows. I ran a test to see how the market performed after closing near its lows on a Fed day. Results below:


Looks fairly positive. Since I’d already established moves of 1% down or more could be a positive, I decided to exclude those instances from the results and re-run it:


Not quite as strong, but still a slight upside edge seems apparent.

Also notable about today was the fact that the market made a recent high. I ran a test to see the following 1) Fed day 2) Made 20-day high. 2) Closed in bottom 10% of range. I was only able to find 3 instances. Therefore I removed the Fed day requirement. Below are those results:


The first few days were choppy, but certainly not bearish. After that the market generally rose.

Some technicians may suggest today was an ugly late-day reversal. I’m having trouble finding much ugly about it.

What A Strong Reaction To The Fed Could Lead To

Last month I presented historical returns following days when there was a strong reaction (+1%) to a Fed (pictured at right) announcement. The results showed that the positive reaction was typically short-lived. Another highly anticipated Fed announcement is due tomorrow. Tonight I thought I’d present historical returns following a disappointment (just in case).

As you can see, a strongly negative reaction to a Fed announcement has typically been followed by a very positive next two weeks. So…if the Fed does something the market “likes” it will go up tomorrow, but over the next two weeks returns will likely be disappointing. If the Fed disappoints the market tomorrow we’ll see afternoon weakness. This disappointment could lead to a nice rise over the next two weeks. So the bulls should want the Fed to upset them tomorrow, and the bears should hope for a short-covering rally.

I find these tendencies to be quite interesting. My untested (as of yet) theory on why this occurs is that “good” news normally will come in the form of a rate cut or other stimulus. This kind of good news happens during times of economic and market weakness and the improvement for both can take time. “Bad” or “disappointing” news many times will come in the form of tightening. The Fed tightens normally when the economy and markets are strong. Just as they can’t fix it in a day, they can’t break it in a day either. Their “bad” decision won’t derail a rally right away and the market will typically continue to trudge higher for a while.

Whatever the reason, the point to remember is this: Don’t get too caught up in the reaction to the Fed tomorrow. The move likely won’t last longer than a day or two before reversing itself.

Edit note: Test was run back to 1982.

Bearish Bar But Fed Looming

Last week I showed how very low volume in a short-term uptrend is a negative. It happened again today along with some other action that hasn’t been constructive historically. Here’s a quick look at what happens when several negative all come together:


For those who would like to review the previous instances they were 6/2/94, 11/6/00, 11/13/01, 10/28/02, 11/29/02.
You don’t want to read too much into just 5 instances, but the formation has been quite bearish in the past. Of course as I mentioned last night, the Fed announcement Wednesday will likely have a larger influence on short-term direction than historical precedents.

Ten High Straight Up

I’ve previously discussed some of the findings in Larry Connors’ book “How Markets Really Work”. In the book Larry looks at certain market situations and determines whether the market has historically outperformed or underperformed when those situations arose. One I previously discussed was a 3-day rise in the market when it is trading under its 200-day moving average. Historically, the market has struggled to add further gains after this has occurred.

Another edge Larry discusses in his book is performance following a 10-day high. In the book he shows there has been a negative expectancy over the next 1-5 days following a 10-day high. I have personally examined 10-day closing highs and found a negative expectancy 3-5 days out when the market is under its 200-day moving average. When it is over the 200-day the expectancy is no longer negative.

On Friday the S&P 500 closed higher for the third day in a row. It also made a 10-day high and closed at a 10-day closing high. I ran some tests to see what happened when you combined some of these 10-high criteria with 3-straight up days. Results of the different combinations I looked at were similar. Below is one example:

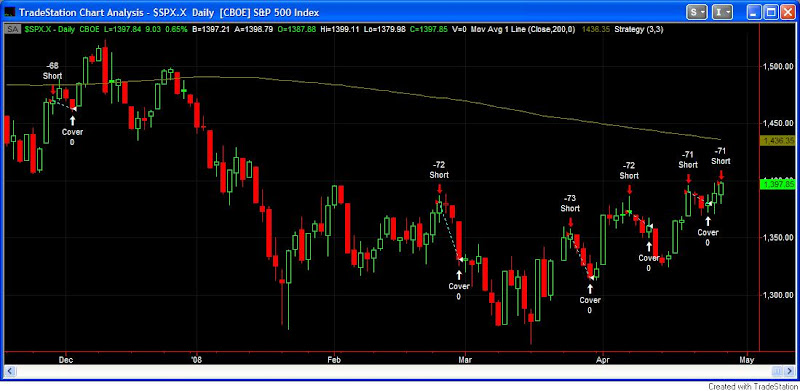
A negative expectancy persisted up through 12-days out. The greatest part of it appeared in the 1st three days. Of course during the next three days there is going to be a Fed announcement. The reaction to that may have a larger affect on market movement than my little test. Still, it’s worthwhile noting the negative expectancy in these situations. Below is a chart showing all the recent instances with a 3-day exit strategy.