Strong Upside Reversal Eeks Out Small Gain

It took a strong turnaround to get the SPX back into positive territory by Thursday’s close. I looked at this several different ways last night in the Subscriber Letter. Below is one study I ran that suggested mildly bearish implications.

This seems to indicate that when it takes a lot to close up just a little you’re likely to see a pullback short-term. Not a huge edge here, but some suggestion that the SPX could struggle the next day or two. I wouldn’t normally base a trade solely on this, but I do think it is worth noting and keeping in the “bag of tricks”.

Examining Traderfeed’s EEM:SPY Sentiment Indicator Concept

In a Traderfeed post on Monday Dr. Brett Steenbarger presented the concept of using the EEM:SPY pair as a sentiment gauge. The idea is that when EEM is outperforming SPY, traders are more willing to take on risk and stocks as an asset class should benefit. When SPY outperforms EEM, then traders are seeking relative safety and the forward outlook for stocks isn’t as good.

Last year I used the Nasdaq vs. S&P 500 relative strength and showed a model that used basically the same risk seeking/aversion idea. A link to that post may be found here. You may also download the model (though you will need to update it with recent prices).

I thought it might be interesting to substitute EEM for the Nasdaq values using that model. (Note: my relative strength calculation, which originally came from Gerald Appel’s Book, “Technical Analysis, Power Tools for Active Investors” is a bit different than Dr. Steenbarger’s calculation. The model calculation examines relative strength over a 10-week period.) After doing so I noted the following observations:

  • Investing only when the EEM is leading the SPY would have resulted in being in a position about 2/3 of the time.
  • By placing your money in SPY, total return since 6/13/2004 would have been a little over 35% using the model vs. about 20% with SPY buy and hold.
  • In both cases all of the gains were made since the March 2009 bottom.
    Prior to that bottom, the model preserved capital quite a bit better than SPY buy and hold.
  • Over that same time period, EEM appreciated about 220%.
  • Buying EEM instead of SPY when the model was positive would have resulted in a gain of about 186%.

In summary, while history is short, Dr. Brett’s EEM:SPY pair seems to work well as a sentiment indicator. As we saw with the Nasdaq:S&P model last year, there appears to be an advantage not only in entering the market when the riskier index is leading, but also in trading the riskier index rather than the SPY.

Mondays After Large Drops On Fridays

In the November 2, 2009 blog post I examined Monday reactions to very bad Fridays. While Friday didn’t qualify for that study, I did look at large Friday drops another way this weekend. This time I used Average True Range (ATR) to define “large”. If the size of the drop was larger than 1.5 times the 20-day ATR then regardless of the size of the % drop, that was considered “large”. Drops of this magnitude on a Friday have almost always led to a bounce.


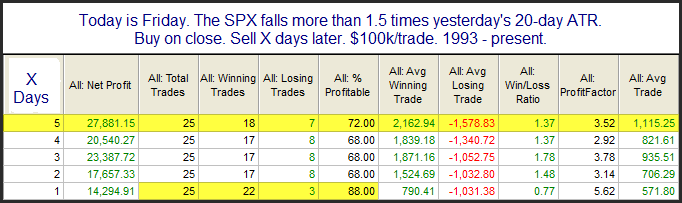
An 88% bounce rate the next day is extremely impressive – especially considering the study is only based on 2 simple parameters (day of week and large drop). The Crash of ’87 occurred on a Monday after a sizable drop on Friday. The Crash of ’29 also occurred on a Monday. It seems that Wall St.’s collective consciousness since over the last several years calls for protecting yourself going into the weekend if Friday is bad. This suggests that big drops on Fridays have often been overreactions and have therefore resulted in a consistent propensity to bounce on Monday.

Nasdaq Breadth Hits an Extreme

I’m seeing mixed indications for the short-term over the last couple of days. One bullish study that the Quantifinder identified last night was from the 11/6/09 blog and examined the exceptionally lopsided Nasdaq Up Volume %. Readings over 90% are quite rare – especially so when the market is in a long-term uptrend. Below I have updated the November study.

Instances are lower than I’d like to see, but with all 8 closing higher in the next day or 2, it appears worth noting this one. Extremely strong volume breadth going into riskier Nasdaq stocks has often led to some follow through when the market is in a long-term uptrend. Below I have listed all 8 instances with a 3-day exit.

Especially notable to me is the fact that the worst drawdown for any instance was only 0.85%. Meanwhile, only 1 instance didn’t see a run-up of at least 1% within the next 3 days. This suggests limited downside potential and solid upside risk/reward.

Quick Notes

Hectic morning here. Yesterday the Quantifinder identified numerous studies with bearish implications. Common themes were low volume, low put/call ratios, and low VIX:VXV Ratio. Below is a link to a post from January:

https://quantifiableedges.blogspot.com/2010/01/declining-spy-volume-at-new-highs.html

For those who may have missed it, below is a link to my chat last Friday with Charles Kirk.

https://kirkreport.com/tkr/ScQB

Lastly, a reminder that today is the webinar by Scott Andrews that will look at using opening gaps to enhance swing trade entries/exits. I haven’t seen a preview yet but I’m told he has some interesting numbers to show.

https://quantifiableedges.blogspot.com/2010/04/using-opening-gap-to-time-swing-trade.html

Some Early-Stage Volume Research

The Subscriber Letter has shown several studies lately that have suggested some of the low-volume rallies we are seeing will often lead to a pullback. It struck me that perhaps it might be worth looking at low-volume rallies in a slightly different way.

One tool that some analysts use is the concept of Distribution Days. Distribution days are basically days where the market sells off on relatively high volume. The theory is that when clusters of these days are seen near a market high it suggests an intermediate-term selloff is likely to ensue. Back in August I posted a study that examined this. It found the concept to be dead wrong. It is most often better to buy into these clusters of high-volume selloffs rather than looking for further selling.

Below I re-ran the results of that August study back to 1988 using the same parameters.


Recall that this study looks to go short, rather than buy. Therefore you are looking at a market that typically rose following such clusters.

Next, instead of looking for clusters of distribution days, I decided to substitute days that rose on volume that was lower than the pervious day’s volume. Here’s how those results came out.


It’s interesting to see here that results are mixed rather than suggestive of upside as the distribution day clusters were. This isn’t terribly surprising since many of the volume-related studies we see suggesting downside are due to low-volume rises rather than high-volume declines.

At this point the research is a bit half-baked, but I plan on expanding on this line of thought in the future.

Using The Opening Gap To Time Swing Trade Entries And Exits

Scott Andrews of “Master the Gap” will be conducting a webinar on Tuesday April 13th at 4:30pm EST that is especially designed for readers of Quantifiable Edges. Scott and I became acquainted within the last year and found it interesting that we utilize very similar approaches for trading very different time frames. While much of the focus with Quantifiable Edges is on swing trading with some discussion of day and intermediate-term edges, Scott uses his quantitative research primarily to trade the opening gaps. His service also covers some other daytrading approaches for times when gap trades are not active.

We’ve had several discussions about how our research tends to be quite complimentary and on a whole can often provide a greater edge for those who may look to incorporate it. Scott’s webinar will show how his gap-focused research can possibly aid traders who are typically more swing-oriented (like me). You may use the link below to see more information on the webinar and to sign up. (It’s free.) If you trade intraday and like the quantitative approach used at Quantifiable Edges, then there’s a good chance you’ll find the webinar interesting.

https://www.masterthegap.com/public/mgcal.cfm?calID=1&caldate=4/13/2010

Charles Kirk Will Be Interviewing Me Live Today At Noon

I’m excited to be speaking with Charles Kirk and his readers today at noon EST. Some of the focus of what we’ll be discussing will be system trading, including some of the systems available here at Quantifiable Edges. If you’d like to attend and perhaps ask some questions then please come by.

https://kirkreport.com/tkr/ScQB

The session will also be archived and I’ll provide a link after it’s all done.

Relatively Strong Drops From Highs

Last night the Quantifinder identified a study that looked at relatively strong drops from highs when the market was in a long-term uptrend. That study last appeared in the 1/19/10 Subscriber Letter. I’ve updated the results table below:

This isn’t the most high-powered edge we’ve seen but it does provided a subtle hint that there may be a bearish edge present over the next few days. I also filtered the results a few different ways, such as using a 50-day high or a 200-day high. No matter how I sliced it results remained fairly similar to these.

What Bonds Rates Are Suggesting For The Intermediate-Term

The fact that bond rates were hitting a new high along with stocks on Monday is notable. Below is a study that last appeared in the 12/23/09 Subscriber Letter that examined this.

Generally, higher interest rates make bonds a more attractive investment. This may lead people to forsake stocks in favor of lower risk returns with improved yield. Implications of this study appear to be longer-term in nature than we usually see. Traders may want to keep this study in mind in the coming weeks.

Should You Apply Fed Day Edges To Today’s Special Meeting?

The Fed will be holding a special meeting today that was just announced last week. (Hat tip Market Rewind.) Below is a link to the announcement.

https://www.federalreserve.gov/boarddocs/meetings/2010/20100405/advancedexp.htm

I’ve published a substantial number of studies related to Fed Days and the action that takes place following them. Most of the studies I’ve published have only looked at scheduled Fed meetings.

Unscheduled Fed meetings have been typically been surprises where the announcement came out of the blue – and the time of day was not consistent. Monday is the first unscheduled Fed meeting that I can recall that has been announced beforehand. While behavior may fall in line with other scheduled Fed meetings, I believe it would be dangerous to make any assumptions in this unique case.

Traders should be aware that news will likely hit in the afternoon that may affect the market.

Lowest Volume In Over A Month Suggesting a Pullback

I’ve noted before how extremely low volume during an upmove can lead to a pullback. Below is a study the Quantifinder identified from the 11/16/09 weekly subscriber letter.

Implications seems to be that there is a downside edge over the next few days – especially days 1 and 2. Below is an equity curve using a 2-day exit strategy.

An Old Reliable SPY Setup

SPY pulled back for the 3rd day in a row on Friday. The action also qualified it for the below study which was was published in the 10/28/09 blog.

“Rate of decline” simply refers to the fact that the losses have been smaller each of the last 2 days on a percentage basis.

Unfortunately the study is not being confirmed by the SPX, which closed up slightly on Friday. It will be interesting to see how it turns out, but I’ve discounted the study in this instance due to the SPX non-confirmation.

Back To Back Outside Days In QQQQ

On Monday QQQQ posted a higher high and a lower low than Friday. This is often referred to as an “outside day”. Interestingly, Friday was also an outside day. Two outside days in a row is quite rare. This was only the 19th time it’s been done since 2000. Looking at performance following the other 18 times shows some compelling results.


These appear to be quite positive implications. They also confirm the December study where I looked at back to back outside days in SPY.

After Down Fridays Over The Past Year…

One place there has been an edge over the last year is in buying Fridays that closed down. Below is a study that illustrates this.

These are some fairly incredible results for just looking to buy a down Friday. Even if you eliminate the 7% winner, which was actually the 1st instance from 3/20/09, results are still very strong. The average trade would be 0.7% instead of 0.9%.

I also looked at how the market has performed over the same time period when Friday has closed up.

It appears the edge has only been on down Fridays.

It is important to understand that this is what I often refer to as an “environmental edge”. In other words, it is something that has worked in the recent past and seems to be a result of the current market environment. It is not an edge that has persisted over a long period of time nor do I expect it to continue to persist for a long period of time from now. That doesn’t mean it isn’t a useful observation, though. In such cases where I believe a setup contains an environmental edge I will look to use it to my advantage until it appears to be losing its effectiveness. Of course I do this with all edges, but environmental edges are on a tighter leash than others.