Using The Opening Gap To Time Swing Trade Entries And Exits

Scott Andrews of “Master the Gap” will be conducting a webinar on Tuesday April 13th at 4:30pm EST that is especially designed for readers of Quantifiable Edges. Scott and I became acquainted within the last year and found it interesting that we utilize very similar approaches for trading very different time frames. While much of the focus with Quantifiable Edges is on swing trading with some discussion of day and intermediate-term edges, Scott uses his quantitative research primarily to trade the opening gaps. His service also covers some other daytrading approaches for times when gap trades are not active.

We’ve had several discussions about how our research tends to be quite complimentary and on a whole can often provide a greater edge for those who may look to incorporate it. Scott’s webinar will show how his gap-focused research can possibly aid traders who are typically more swing-oriented (like me). You may use the link below to see more information on the webinar and to sign up. (It’s free.) If you trade intraday and like the quantitative approach used at Quantifiable Edges, then there’s a good chance you’ll find the webinar interesting.

https://www.masterthegap.com/public/mgcal.cfm?calID=1&caldate=4/13/2010

Charles Kirk Will Be Interviewing Me Live Today At Noon

I’m excited to be speaking with Charles Kirk and his readers today at noon EST. Some of the focus of what we’ll be discussing will be system trading, including some of the systems available here at Quantifiable Edges. If you’d like to attend and perhaps ask some questions then please come by.

https://kirkreport.com/tkr/ScQB

The session will also be archived and I’ll provide a link after it’s all done.

Relatively Strong Drops From Highs

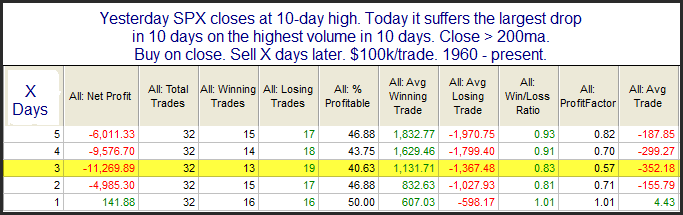
Last night the Quantifinder identified a study that looked at relatively strong drops from highs when the market was in a long-term uptrend. That study last appeared in the 1/19/10 Subscriber Letter. I’ve updated the results table below:

This isn’t the most high-powered edge we’ve seen but it does provided a subtle hint that there may be a bearish edge present over the next few days. I also filtered the results a few different ways, such as using a 50-day high or a 200-day high. No matter how I sliced it results remained fairly similar to these.

What Bonds Rates Are Suggesting For The Intermediate-Term

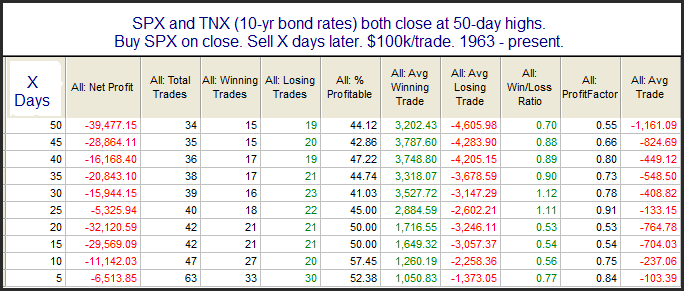
The fact that bond rates were hitting a new high along with stocks on Monday is notable. Below is a study that last appeared in the 12/23/09 Subscriber Letter that examined this.

Generally, higher interest rates make bonds a more attractive investment. This may lead people to forsake stocks in favor of lower risk returns with improved yield. Implications of this study appear to be longer-term in nature than we usually see. Traders may want to keep this study in mind in the coming weeks.

Should You Apply Fed Day Edges To Today’s Special Meeting?

The Fed will be holding a special meeting today that was just announced last week. (Hat tip Market Rewind.) Below is a link to the announcement.

https://www.federalreserve.gov/boarddocs/meetings/2010/20100405/advancedexp.htm

I’ve published a substantial number of studies related to Fed Days and the action that takes place following them. Most of the studies I’ve published have only looked at scheduled Fed meetings.

Unscheduled Fed meetings have been typically been surprises where the announcement came out of the blue – and the time of day was not consistent. Monday is the first unscheduled Fed meeting that I can recall that has been announced beforehand. While behavior may fall in line with other scheduled Fed meetings, I believe it would be dangerous to make any assumptions in this unique case.

Traders should be aware that news will likely hit in the afternoon that may affect the market.

Lowest Volume In Over A Month Suggesting a Pullback

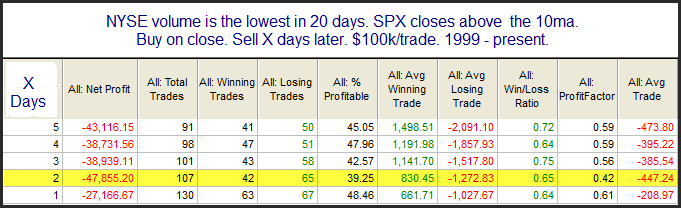
I’ve noted before how extremely low volume during an upmove can lead to a pullback. Below is a study the Quantifinder identified from the 11/16/09 weekly subscriber letter.

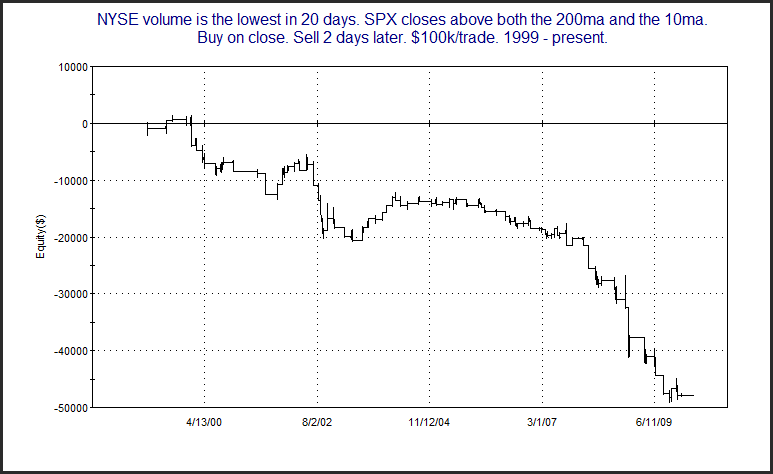
Implications seems to be that there is a downside edge over the next few days – especially days 1 and 2. Below is an equity curve using a 2-day exit strategy.

An Old Reliable SPY Setup

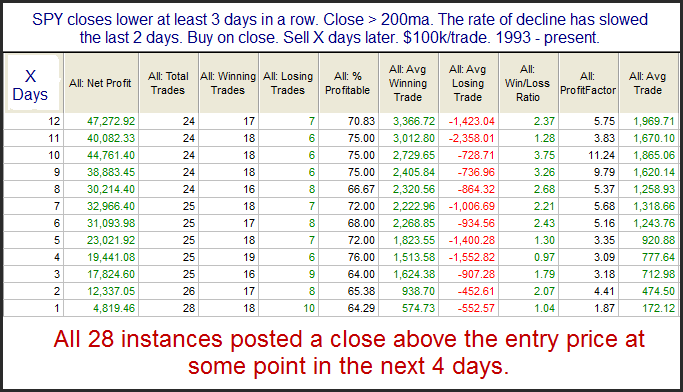
SPY pulled back for the 3rd day in a row on Friday. The action also qualified it for the below study which was was published in the 10/28/09 blog.

“Rate of decline” simply refers to the fact that the losses have been smaller each of the last 2 days on a percentage basis.

Unfortunately the study is not being confirmed by the SPX, which closed up slightly on Friday. It will be interesting to see how it turns out, but I’ve discounted the study in this instance due to the SPX non-confirmation.

Back To Back Outside Days In QQQQ

On Monday QQQQ posted a higher high and a lower low than Friday. This is often referred to as an “outside day”. Interestingly, Friday was also an outside day. Two outside days in a row is quite rare. This was only the 19th time it’s been done since 2000. Looking at performance following the other 18 times shows some compelling results.


These appear to be quite positive implications. They also confirm the December study where I looked at back to back outside days in SPY.

After Down Fridays Over The Past Year…

One place there has been an edge over the last year is in buying Fridays that closed down. Below is a study that illustrates this.

These are some fairly incredible results for just looking to buy a down Friday. Even if you eliminate the 7% winner, which was actually the 1st instance from 3/20/09, results are still very strong. The average trade would be 0.7% instead of 0.9%.

I also looked at how the market has performed over the same time period when Friday has closed up.

It appears the edge has only been on down Fridays.

It is important to understand that this is what I often refer to as an “environmental edge”. In other words, it is something that has worked in the recent past and seems to be a result of the current market environment. It is not an edge that has persisted over a long period of time nor do I expect it to continue to persist for a long period of time from now. That doesn’t mean it isn’t a useful observation, though. In such cases where I believe a setup contains an environmental edge I will look to use it to my advantage until it appears to be losing its effectiveness. Of course I do this with all edges, but environmental edges are on a tighter leash than others.

Mild Pullbacks From Strongly Overbought Conditions

I’ve shown many times before how strong selloffs rarely end when the 1st day of the bounce is meek. Most of the time to get a strong multi-day move off a low, you need a convincing day-1 bounce. Tonight I decided to flip this concept on its head a little bit and examine what happens after a small pullback day during a strong upmove. For this study I used the 2-day RSI. The 2-day RSI is a very sensitive indicator so it would take a very small decline from a very overbought position in order for it to remain above 90 on a down day. This is what happened on Thursday and what I examined below.


There appears to be a fairly strong upside tendency over the last 13 years based on these results. The edge pretty much plays itself out within the first two days though. Looking further out in time did not showing significant results.

Fed Day Readings

Today is a Fed Day. I’ve shown in the past how Fed Days have had a substantial upside bias. This was illustrated most clearly in my September 23, 2009 post showing a chart of all Fed Days. Of course at this point in time the market is strongly overbought. For those wondering whether this negatively impacts the chances of a positive Fed Day, it doesn’t appear to based on this post from March 18, 2009.

With trading conditions likely to be slow mid-day as the announcement approaches, traders may want to review some of my other Fed Day studies as well.

I’d also like to point out some recent work by others on the subject. This past Friday Tom McClellan reproduced my September 23rd Fed Day chart for his “Chart In Focus” and added his own observations and commentary. Tom’s chart actually went back a bit further than mine and he breaks it down by fed chairman, which I found interesting. You can see Tom’s take on it here:

https://www.mcoscillator.com/learning_center/weekly_chart/fomc_announcement_days_tend_to_close_up/

And last night in his “Gap Wrap” video, Scott Andrews of Master the Gap showed some interesting research that discussed the probabilities associated with gaps filling on Fed Days. He showed both gaps up and gaps down statistics, and the results were quite interesting. You may view his video here:

https://www.masterthegap.com/public/410.cfm

Options Expiration Week Performance By Month

Some readers may recall that I’ve previously labeled December op-ex week “The Most Wonderful Time of the Year”. Op-ex week in general is normally pretty good. And while December has been the most reliable month, both March and April have produced more profits going back to 1984. Below is a table that breaks down op-ex week performance by month. It assumes buying the close on the Friday prior to op-ex and selling the close of op-ex Friday. If there was a holiday on that Friday, then the Thursday before the weekend was bought. I excluded op-ex week of September 2001 due to the extreme (and horrific) circumstances.

This positive seasonality could provide a bit of a tailwind this week for the market.

Testing Common Knowledge About Volume On An SPX Breakout

In last night’s Subscriber Letter I looked at the breakout to a new closing high in the S&P 500. I defined a breakout to be a close at a 50-day high after having no closes at a 50-day high for at least 10 days. In general these breakouts showed positive momentum for about a week and then fizzled out. I broke down the breakouts a number of different ways. One way was by using volume. I wanted to test the common supposition that high volume was better when an index broke out. Those results were quite interesting and I’ve included them below. First instances like yesterday with lower NYSE volume.

Here we see a solid inclination for some upside follow through over the next week. But how does this compare to those times that the volume came in higher on the day of the breakout?

What was a decent edge over the first week is now essentially edgeless. Many times on this blog I’ve shown how common trading knowledge is often wrong. This serves as yet another example of why it is important to question common knowledge.

If you’d like to see more results related to my study of breakouts last night you may you may take a free 1-week trial of Quantifiable Edges by signing up here. If you’ve trialed in the past but not in a while, then you may email me at support @ quantifiable edges.com (no spaces).

A Put/Call Study With Intermediate-Term Bearish Implications

Tuesday’s Put/Call Ratio suggested some complacency among options traders. Below is a study I’ve shown a few times in the past in the Subscriber Letter that appeared in last night’s Quantifinder for gold subscribers.

This study gets off to a bit of a slow start, but then there appear to be solidly bearish implications for up to several weeks out. Even as much as 4-5 weeks out the % winners is exceptionally low, as are the win/loss ratio, the profit factor and the average trade.

Another Example Of Why I Prefer The 1% FTD Rule

On February 11th the market put in a Follow Through Day according to the original IBD definition requiring at least a 1% rise in one of the major indices on rising volume. I mentioned the Follow Through Day and dedicated a few posts to it in mid-February. The S&P is now less than 1% from new highs and very close to hitting a level that that would qualify the current rally as “successful” based on the rules I set up in the original Follow Through Day test a couple of years ago. This would mean the lesser of 1) a new high or 2) a rally twice as large as the distance from the close of the Follow Through Day to the bottom of the downmove. Meanwhile the Russell 2000 is already hitting new highs.

In the last few years IBD has changed their rules and stated that a 1.7% rally on higher volume should be required instead of a 1% rally. Ironically the first major index to actually put in a 1.7% rally on higher volume since the February bottom is the Russell 2000, which did it on Friday – as it was hitting new highs. Not a great bottom call when you’re already at new highs. Over the last few years I’ve suggested ignoring the new rule. In a study I did a little over 2 years ago I showed how waiting for a 1.7% FTD would have missed several rallies. The current instance now serves as yet another example. Not that I a see a huge value in the 1% FTD rule, but it has been at least marginally effective and can be used to set up a positive risk/reward scenario. Additionally, requiring a 1.7% FTD not only puts you at risk of missing the rally but it also hasn’t proven to be any more predictive than the original 1% requirement.