When Extremely Overbought Barely Pulls Back

Below is one pattern I examined in last night’s Subscriber Letter that had interesting results.

To qualify for the study the market first needs to be very overbought and then second it needs to pull back extremely gently. The 2-day RSI is such a sensitive indicator that any decent pullback – even from a very overbought condition – would normally see it close below 85. While the sample size is very small, historically this has always been followed by a pullback.

A Pattern Suggesting A Pullback

Large gaps up like yesterday that reach new highs, go unfilled and finish above the open don’t often follow through over the short-term. Below is a study that appeared in last night’s Quantifinder that demonstrates this.


This study suggests a fairly potent downside edge over the next 3 days. Occurences are a little bit low but with only 25% of instances trading higher 3 days out and an average return of -1.4% I believe it is worth taking under consideration.

Short-term Persistence a Positive For the Intermediate-term

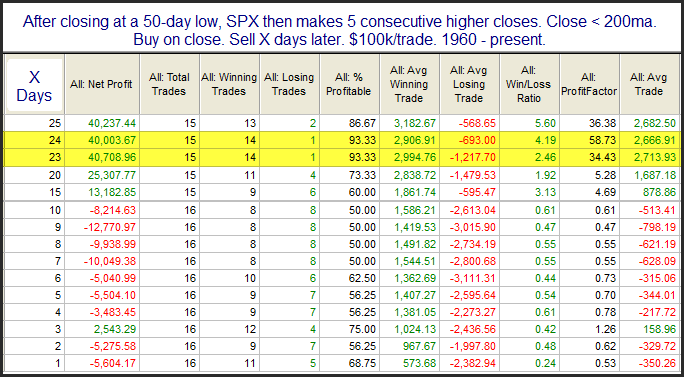
Monday marked the 5th higher close in a row. This kind of persistence coming off a low has almost always led to further upside over the intermediate-term. This can be seen in the study below.

Short-term returns were very choppy. Looking out a month or so the results strongly favor the bulls. In last night’s Subscriber Letter I listed all the instances. What was interesting is that there was positive representation from every decade.

Follow Through Days Before The 4th Day

It was pointed out to me that IBD declared Wednesday to be a Follow-Through-Day. Since it was only the 2nd day off the bottom this seemed odd to me. I’ve done an extensive series quantifying Follow-Through-Days. IBD’s rules have been fluid over time and sometimes nonsensical based on the evidence. From all appearances they have done very little actual research on their own indicator, and have never shared any verifiable results.

One basic guideline IBD has suggested with Follow-Through-Days is that they should occur between the 4th and 10th day of the beginning of a rally. I examined FTD’s after the 10th day in the February 29, 2008 blog post. At that time I found that FTD’s after day 10 are NOT less reliable as IBD claims. In fact, the small sample was much more reliable.

But what of FTD’s that occur prior to Day 4?

Using the original basic assumptions from the January 14, 2008 study I adjusted the requirement from 4 days (standard) to 2 days (Wednesday’s “FTD”). Below is a quick comparison since 1970. Again, refer to the original basic assumptions for definitions of success and failure of a FTD.

4th Day of Rally Is Earliest Possible FTD – 38 winners and 35 losers.
2nd Day of Rally Is Earliest Possible FTD – 39 winners and 43 losers.

So it appears that allowing FTD’s on day two did identify one additional rally. I looked to see when this additional “success” took place. It was July of 1973. The total rally only lasted 3 weeks. The reason it was “successful” if you entered on the FTD on the 2nd day off the bottom was that the “success” target of a move of twice the size of the distance from the bottom to the FTD was more easily achieved. This “successful” July rally never even went on to break the swing highs of May. Not exactly the kind of winner most traders would be disappointed to miss out on. And while it met the test definition, when looking at a chart it likely isn’t a rally that most traders would even consider successful. Also note that shortening the requirement to 2 days from 4 days triggers 8 more losers.

I don’t agree with many of IBD’s teachings on FTD’s, but in my eyes this particular rule (waiting until day 4) is a very good one. I personally wouldn’t ignore it and am a bit surprised that they did.

Gaps Up From A 50-day Low

As I type this morning the futures are up between 1% and 1.5%. Below I show results since 2003 of gaps of different sizes occuring right after a 50-day low.

First are gaps between 1% and 1.5%.

Very low instances but very poor performance.

Now let’s look at instances of gaps above 1.5%.

It appears the bigger the gap the better for the bulls this morning.

Oversold Short and Intermedaite-term Suggest a Short-Term Bounce

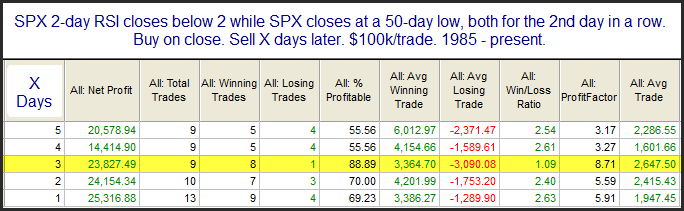
Below is a study from last night’s Subscriber Letter. It looks at when happens when ths SPX has been oversold short-term (via RSI2) and intermediate-term (50-day low).

With 8 of 9 instances trading higher and an average return of 2.65% 3 just 3 days later there appears to be an upside edge. Of course this market has been ignoring oversold conditions for several days now. Still, I’d be more inclined to bet on a short-term bounce than against one.

CBI Hits 14 Suggesting A Bounce

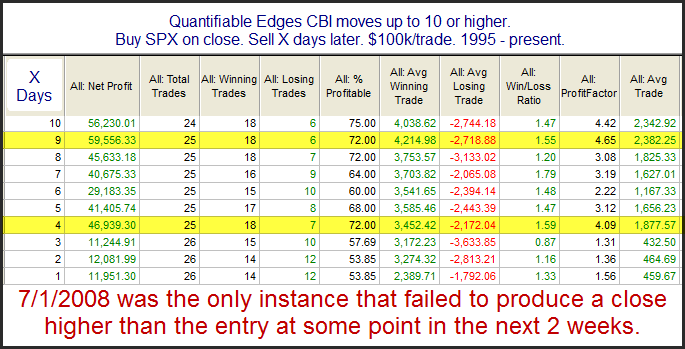
One notable breadth indication that hit an extreme Tuesday is the CBI, which jumped up to 14. I alerted followers of this via Twitter near the close. As I’ve written about and discussed many times in the past, moves to 10 or above have typically been suggestive of a strong bounce within a few days. Below is a simple test that shows results of buying a move up to 10 or higher and then exiting X days later.

More information on the CBI may be found using the CBI label below. Also, I recently updated the Catapult and CBI presentation in the members section of the website. If you would like to see the presentation or see the trade triggers that have pushed the CBI up to 14, you may take a free trial. (If you are already in the system but haven’t trialed yet in 2010, just drop me a note and I’ll set you up with one.)

Big Gaps Down When SPY Is Near Recent Lows

A little over a week ago I showed a study that examined large gaps up from high levels. The results were very compelling and suggested a strong downside edge. Today we are presented with a similar situation in the opposite direction. So this morning I ran some tests that looked at large gaps down from a low area. Below is one example typical of what I saw:

Perhaps a mild upside edge could be found, but certainly nothing as compelling as last week’s study. Results were volatile as well, with the average intraday drawdown over 1.6% and the average run-up over 2%.

Below I tightened the requirements to a 1% gap and showed all instances. Results were similar – just with fewer instances.

Bottom line is there may be a slight upside edge, but the direction is certainly no layup. No matter the direction be prepared for some volatile action today.

Two 90% Down Days In One Week

It was just a little over a week ago that I was examining what occurs after the market posts 2 90% Up Days in a 1-week period. The results appeared quite bullish. Thursday we saw the 2nd 90% down day in the last 3 days. I stretched the requirement out to 1 week and took a look.

For the short-term at least, such negative breadth appears to suggest a bounce.

Predicting Fed Rates

A good question a reader sent to me yesterday was to explain how futures or options may be used to predict Fed rates. A great source to gain a better understanding of this subject is the Cleveland Fed’s website. The link below is to their FAQ’s page:

https://www.clevelandfed.org/research/data/fedfunds/faq.cfm

Questions 4 and 8 deal directly with this topic. Copy and pasting the information found there is a bit difficult since they use tables in the description. Should you have interest in how it is all done, simply click the above link and read the answers to questions 4 and 8.

Of course gaining a better understanding of how futures may be used to gauge expectations doesn’t mean you want to actually do the calculations. Fortunately, they do them for you. The link below is updated daily and shows estimates for meeting outcomes.

https://www.clevelandfed.org/research/data/fedfunds/

Currently the estimates are suggesting there is virtually no chance of a rate increase tomorrow.

Of course even if you know what the Fed is going to do with rates, that doesn’t tell you any probabilities or edges related to market reaction and behavior on or around these meetings. For that information, you’ll need to read “The Quantifiable Edges Guide to Fed Days“. The next Fed Day is tomorrow, June 23rd. The guide is available in ebook or paperback. If you would prefer the paperback, but want to read it tonight, just email your purchase receipt before tomorrow’s meeting and I’ll send you the ebook version.

Edit: Jeff Pietsch of Market Rewind in the comments section provided a link to a tool from the CME that predicts rates. Below is a lnk to the tool:

https://www.cmegroup.com/trading/interest-rates/fed-funds.html

Yesterday’s SPY Action Suggesting More Selling?

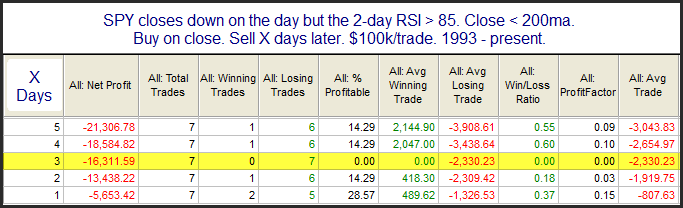
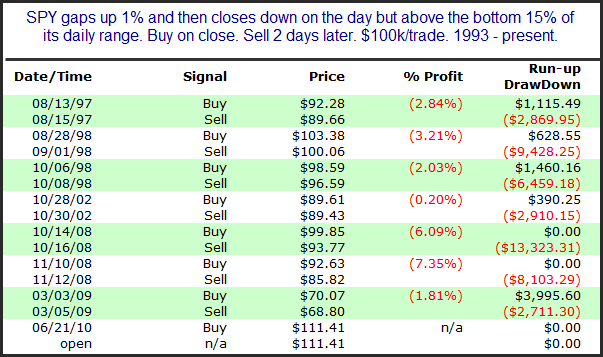
It’s quite rare for the market to 1) gap up large and then 2) close down on the day BUT 3) a good distance off its lows. Yesterday the SPY didn’t even close in the bottom 25% of its daily range. Even bounces much smaller than yesterday’s late day bounce can take some of the positive energy away from the next day. In last night’s Subscriber Letter I loosened the parameters a bit and still was presented with a rare but fairly compelling setup. Indications were bearish over the next few days, with 2 and 3-day exits both showing all 7 previous instances with negative returns. Below I show all trades using a 2-day exit.

The number of occurances is low but when stats are this overwhelming I make sure not to ignore them. Especially notable is that every instance saw an intraday low at least 2.7% below the entry price at some point in the next 2 days.

A Large Gap Up From A High Level

Looks like there is going to be a sizable gap up this morning. I’ve shown before how large gaps up from 10 and 20-day highs in the SPY often lead to an intraday selloff. While the SPX closed at a 20-day high on Friday, the SPY and the futures were down slightly.

SPY closed down a little rather than up a little because it went ex-div. Rather than looking at 10-day highs I looked at closes in the top 10% of the 10-day range. A slightly different twist. (Note that the SPY missed qualifying for this by a few pennies as well thanks to the dividend. Still, I felt the current situation represented the spirit of the setup.)

Rather than a stats table, I’ve listed below all 11 instances since 2003.

10 of 11 instances saw declines from open to close. The far right column is even more interesting. In only 1 case did the max intraday runup from the opening price exceed 1% (3/16/09). In contrast, 9 of 11 exceeded a 1% pullback, and all 11 exceeded a 0.8% pullback. This all suggests to me that intraday risk/reward is skewed to the downside today.

Related Quantifiable Edges Studies

The Mystery of the Declining Instances

One question I get fairly often is “Why does the number of instances decline when you look further out in a study?” I’ve answered it on a few occasions but recently realized I should make it a post.

As an example I ran a simple study below that looks at performance following a 1% drop in the S&P 500.

Declining instances are common with some studies – especially studies like this with a large number of instances. The issue has to do with repeat occurrences of the setup. Here we see there were 454 occurrences that showed up with a 1-day holding period. 77 times it happened twice in a row, so when you look at the 2-day exit results now your number of instances drops to 377. Looking out 5 days the instances drops to 246, meaning after the 1st instance there were 208 times where you again had a 1% drop during the 4 days following all “initial” instances.

I do this to avoid double counting. When dealing with oversold statistics if you double (or triple, etc.) count them then your results will most often be skewed unfairly bullish. The 2nd instance you’re more oversold than the 1st and the 3rd even more so. Now when the bounce comes it’s being counted 3 times if you decide to track the stats on all 3.

The opposite holds true for overbought studies with bearish results. Double counting there would often skew them even more bearish.

So when I run the stats on such studies, I make the assumption that the 1st time it triggers it puts you “all in” and your exit will be X days later. You can’t get another buy trigger until the first one closes out.

So there you have it – “The Mystery of the Declining Instances” is finally solved.

The Quantifiable Edges Guide to Fed Days released in paperback

The early reviews are in and the paperback version is now available! After releasing the ebook version last week, the paperback edition of “The Quantifiable Edges Guide to Fed Days” was released this week. With the next Fed Day now less than a week away, there’s no time to waste.
Below are some early reviews:

“What I like about Rob’s work is the thoroughness that he approaches the subject. This attitude is exhibited in the book…In my view, a book that deserves a place in S&P trader’s library.”-Ray Barros
TradingSuccess.com
Click here for full review

“I would highly encourage readers looking to understand more about how the market reacts to Fed Days to take QE’s book for a spin.”
-Michael Stokes
MarketSci
Click here for full review

The next Fed Day is this upcoming Wednesday, June 23rd. Are you ready?

Click here for ordering information.