From 1% Up Intraday to 1% Down Close

Below is a study that appeared in last night’s Subscriber Letter that looks at Tuesday’s volatile action.

A few notes:

1) While results are explosive, instances are very low. Rather than including this among my Active Studies List I have simply decided to track it going forward.
2) Without the 200ma filter the results are no longer bullish. There were some big declines followingthis type of action during a downtrend.

Extremely & Unusually Negative Breadth

Breadth that was so extremely negative as was seen on Friday is rare. It is especially rare when the market is not already downtrending and reaching oversold levels. The NYSE Up Volume % of 4.5% suggests nearly everything was being sold. Indiscriminate selling like this hints at panic. Below is a study last shown on the blog on February 5th that exemplifies this.

Instances are low, but with all 7 bouncing in the next day or two I believe it’s worth noting and perhaps considering now, and then tracking going forward.

Strong Rally On Weak Volume For Nasdaq

Striking about Monday’s rally was the very low volume in the Nasdaq. It not only fell below the high levels achieved during Thursday and Friday’s wild trading, but it actually posted the lowest volume in over a week. This brought about a compelling study from the May 19,2009 blog post. I’ve updated that study below:

Monster Gaps Higher

As of now the market is gapping up very strongly on bailout news. SPY is up over 4% as I type. I looked back to find other instances of monster gaps and how the market behaved on those days. For this study I required the gap to be at least 3%. Results below.

Only 4 instances make it dangerous to draw any solid conclusions. I’ll let readers do their own interpretations. I would note that all 4 instances took place in September or October of 2008.

CBI Only At 2 After Thursday’s Drop

So the big question I got yesterday from readers was “What’s the CBI reading?” For those new to the blog the CBI is my Capitulative Breadth Indicator. There is a system I’ve traded since 2005 that I call my Catapult System. It basically looks to buy into S&P 100 stocks that are undergoing capitulative selling. The CBI measures the number of active triggers. When it moves up to levels of 7-10 or more it suggests the market as a whole is becoming oversold to the point that a reversal is highly likely. Extreme selloffs like October 2008 and September 2001 have seen it go much higher (into the 40’s). I wrote many posts about the CBI in 2008 and 2009 since there were so many selloffs that induced high readings. For more information and related research you may us the link below.

https://quantifiableedges.blogspot.com/search/label/CBI

Also, below is the original CBI intro post and explanation.

https://quantifiableedges.blogspot.com/2008/01/my-capitulative-breadth-indicator.html

Since the March 2009 bottom the CBI has not had a significant reading, with the highest only reaching 3. It hit 2 a few days ago and even with yesterday’s selling did not move any higher. Though I checked in the middle of the 2:45 madness and if the market closed there it would have been a “6”. A high CBI is certainly not required for a rally, but I’m personally more comfortable getting aggressively long when I see it.

Should the CBI spike higher over the next few days I will be sure to note it here. And as always I will share the individual Catapult trades that make up the CBI in the Subscriber Letter.

A Bullish Reversal Pattern In SPY

What struck me most about Wednesday’s action was the fact that the market closed above it’s open but still down on the day. This little pattern can be bullish under the right circumstances. It will often signal a reversal after there has been a move down.

I showed a few studies related to this in last night’s subscriber letter. Below is one.


This simple pattern suggests a bounce appears likely.

Best Wishes, Thanks, And Congrats To Dr. Brett

As probably 99% of the people who read Quantifiable Edges are aware, the Traderfeed blog, written by Dr. Brett Steenbarger is nearing an end.

Over the last several years Dr. Brett’s provided a wonderful example for traders, bloggers, and service providers. The energy he put towards the blog and the rest of his work was astounding. His posts were consistently thought provoking and provided many sparks for further research on this site and others. And he’s done it with the kind of integrity not often found on Wall St.

Quantifiable Edges would have come to be without Dr. Brett. But without his inspiration, support, and encouragement throughout the last few years it certainly wouldn’t be as far along as it currently is. Any blog readers or subscribers who have benefitted from my work should be aware that some credit needs to go to the good doctor.

As readers know, I try to quantify most everything here. While it’s impossible to quantify Dr. Brett’s contribution, below is a never-before-seen picture that tells a (true) story of something that happened back in 2008…


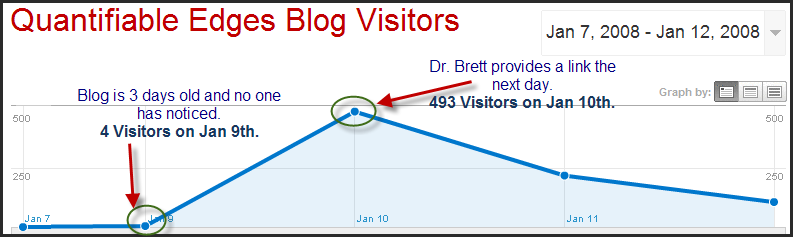
Of course that’s just one small example.

Thank you Dr. Brett. Congratulations on your new endeavor. Whoever convinced you to join their firm will surely benefit greatly, just as so many others have over the years. While you will soon be silent on the internet, I look forward to eventually hearing of the good things you’ll accomplish in the next several years.

First Trading Day of May Has Been Seasonally Bullish

Monday is the 1st trading day of May. I’ve discussed many times before how the 1st trading day of the month tends to be seasonally bullish. Last July I showed a chart breaking it down by month. May has been one of the strongest months, both based on total return and % profitable. Below is a graph showing performance on the 1st day of May since 1987.

Also notable is that 22 of the last 23 years the SPX has closed above the final April close on either the 1st or 2nd day of May. The lone exception was 1989, which lost a total of 0.5% over the 2 days.

Strong Drops Just Before A Fed Day

Likely partially due to the fact that Fed Days have generally been positive, strong selloffs the day before have been uncommon. One study I ran last night looks at other times the SPX sold off at least 1% on the day before a Fed Day. The general results are below. It should be noted that I only looked at scheduled Fed Days. Unscheduled/surprise meetings were not included in the results.

These would seem to strongly favor a bounce on Wednesday. In last night’s Letter I included all the individual instances along with some additional discussion.

NDX Closes Above 10ma for 50 Days In A Row – 1st Time Ever

The NDX has now had a remarkable streak of 50 closes above the 10ma. That’s over 2 months without even a mild pullback. This is the longest streak since the index’s inception in 1986. Below is a chart that shows the number of days the NDX has spent above it 10ma at any point in time.

(click chart to enlarge)

It’s a little difficult to read when try to jam so much history into a small area, but the spike on the right is the current count and it is up to 50. The previous high lasted 47 days in 1989.

In last night’s Subscriber Letter I also discussed research associated with long streaks in the Dow (now at 48 days) and S&P (recently ended at 42 days). The general finding was that such persistent upmoves have a very strong tendency to continue up after the 1st pullback occurs. Rarely will you see an abrupt end to these kind of moves.

If you’d like to see that research then you may take a free trial by clicking here. If it’s been more than 6 months since your last trial you may email me at support @ quantifiable edges.com (no spaces) and I’ll be happy to set you up with one.

Strong Upside Reversal Eeks Out Small Gain

It took a strong turnaround to get the SPX back into positive territory by Thursday’s close. I looked at this several different ways last night in the Subscriber Letter. Below is one study I ran that suggested mildly bearish implications.

This seems to indicate that when it takes a lot to close up just a little you’re likely to see a pullback short-term. Not a huge edge here, but some suggestion that the SPX could struggle the next day or two. I wouldn’t normally base a trade solely on this, but I do think it is worth noting and keeping in the “bag of tricks”.

Examining Traderfeed’s EEM:SPY Sentiment Indicator Concept

In a Traderfeed post on Monday Dr. Brett Steenbarger presented the concept of using the EEM:SPY pair as a sentiment gauge. The idea is that when EEM is outperforming SPY, traders are more willing to take on risk and stocks as an asset class should benefit. When SPY outperforms EEM, then traders are seeking relative safety and the forward outlook for stocks isn’t as good.

Last year I used the Nasdaq vs. S&P 500 relative strength and showed a model that used basically the same risk seeking/aversion idea. A link to that post may be found here. You may also download the model (though you will need to update it with recent prices).

I thought it might be interesting to substitute EEM for the Nasdaq values using that model. (Note: my relative strength calculation, which originally came from Gerald Appel’s Book, “Technical Analysis, Power Tools for Active Investors” is a bit different than Dr. Steenbarger’s calculation. The model calculation examines relative strength over a 10-week period.) After doing so I noted the following observations:

  • Investing only when the EEM is leading the SPY would have resulted in being in a position about 2/3 of the time.
  • By placing your money in SPY, total return since 6/13/2004 would have been a little over 35% using the model vs. about 20% with SPY buy and hold.
  • In both cases all of the gains were made since the March 2009 bottom.
    Prior to that bottom, the model preserved capital quite a bit better than SPY buy and hold.
  • Over that same time period, EEM appreciated about 220%.
  • Buying EEM instead of SPY when the model was positive would have resulted in a gain of about 186%.

In summary, while history is short, Dr. Brett’s EEM:SPY pair seems to work well as a sentiment indicator. As we saw with the Nasdaq:S&P model last year, there appears to be an advantage not only in entering the market when the riskier index is leading, but also in trading the riskier index rather than the SPY.

Mondays After Large Drops On Fridays

In the November 2, 2009 blog post I examined Monday reactions to very bad Fridays. While Friday didn’t qualify for that study, I did look at large Friday drops another way this weekend. This time I used Average True Range (ATR) to define “large”. If the size of the drop was larger than 1.5 times the 20-day ATR then regardless of the size of the % drop, that was considered “large”. Drops of this magnitude on a Friday have almost always led to a bounce.


An 88% bounce rate the next day is extremely impressive – especially considering the study is only based on 2 simple parameters (day of week and large drop). The Crash of ’87 occurred on a Monday after a sizable drop on Friday. The Crash of ’29 also occurred on a Monday. It seems that Wall St.’s collective consciousness since over the last several years calls for protecting yourself going into the weekend if Friday is bad. This suggests that big drops on Fridays have often been overreactions and have therefore resulted in a consistent propensity to bounce on Monday.

Nasdaq Breadth Hits an Extreme

I’m seeing mixed indications for the short-term over the last couple of days. One bullish study that the Quantifinder identified last night was from the 11/6/09 blog and examined the exceptionally lopsided Nasdaq Up Volume %. Readings over 90% are quite rare – especially so when the market is in a long-term uptrend. Below I have updated the November study.

Instances are lower than I’d like to see, but with all 8 closing higher in the next day or 2, it appears worth noting this one. Extremely strong volume breadth going into riskier Nasdaq stocks has often led to some follow through when the market is in a long-term uptrend. Below I have listed all 8 instances with a 3-day exit.

Especially notable to me is the fact that the worst drawdown for any instance was only 0.85%. Meanwhile, only 1 instance didn’t see a run-up of at least 1% within the next 3 days. This suggests limited downside potential and solid upside risk/reward.