An Updated Look At Intermediate-Term Highs Just Before A Fed Day
No matter how you look at it, the intermediate-term high appears to take away the edge.
Yesterday I showed a SPY study that examined the 1st 5-day low in over 2 weeks. QQQ triggered its own version on Wednesday. I showed the QQQ version last in the 11/12/10 subscriber letter. There I found that the edge played out favorably below the 200ma but above it the edge was not apparent. QQQ is below the 200ma, so here are the results from that 2010 study.
The numbers here appear very strong.
Even with the SPX rising on Friday, the VIX managed to close up a bit. The VIX will typically trade in a direction opposite the SPX, so it is unusual that they both close higher. On Fridays, the VIX has a natural tendency to dip in the afternoon, so it is most unusual to see them both close higher on Friday. The study below was last seen a few months ago in 9/17/12 blog. It examines other instances of the VIX and SPX both closing higher on a Friday while the SPX is in an uptrending market. All stats are updated.
As you can see, there appears to be a decent downside edge suggested by this study. That edge primarily plays out over the first three days.
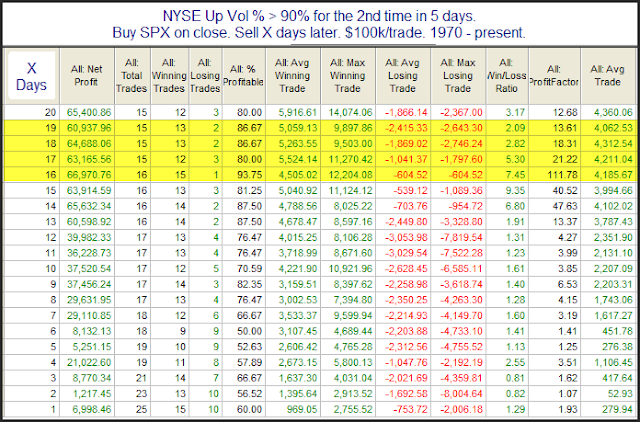
Friday was the 2nd 90% Up Volume day within 5 days. In the past this has been a bullish indication for the intermediate-term. Below is an updated results table from the 10/11/11 Subscriber Letter study that showed this.
While the market appears overdone short-term, the breadth thrust we saw last week appears to be a positive sign for the intermediate-term.
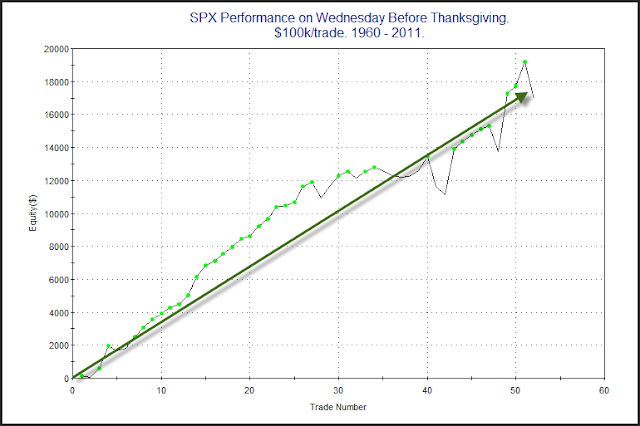
Thanksgiving has typically shown some pretty consistent seasonality. Both the Wednesday before and the Friday after have exhibited bullish tendencies while the Monday after has been slightly bearish. A couple of years ago I showed a table breaking it all down by day. Today I decided to show a profit curve that represents simply owning the SPX from Tuesday’s close through Wednesday’s close.
Looks pretty good to me. Happy Thanksgiving!
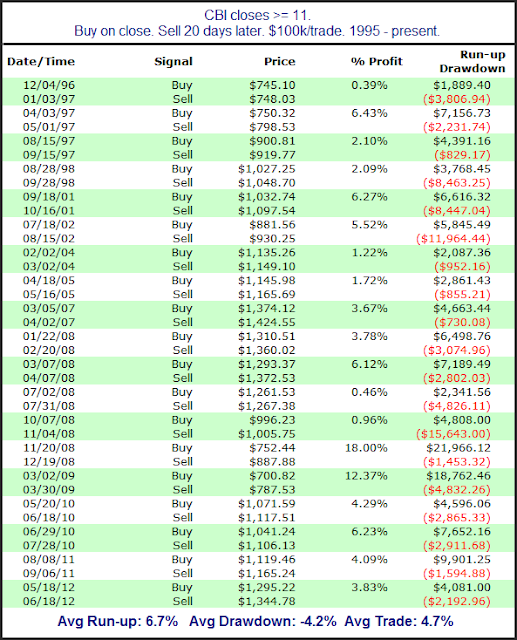
I’ve written an awful lot about the Quantifiable Edges Capitulative Breadth Indicator (CBI) here on the blog. The CBI moved up from 9 to 11 on Friday. Many readers are aware that a reading of 10 or higher has been a strong short-term bullish signal over the years. But I have not discussed intermediate-term implications of high readings before, except in the Subscriber Letter. Below is a study from last night’s Letter with results of buying the SPX when the CBI reaches 11 or higher and then selling 20 days later.
As you can see, SPX has been a perfect 19-0 when looking out 20 days from the first CBI reading of 11+. Drawdown stats are larger than most traders would prefer. Still, it appears a reading of this magnitude often suggests a washout is in progress that should set the stage for at least a multi-week bounce. We may not reach the “final” bottom here, but this study indicates we should see at least a temporary bottom form soon.
Where the market closes within its daily range can be an indicator of sentiment. Over the years I have shown studies indicating persistent closes in one direction often lead to a reversion. An example of overly-optimistic closes was shown in the July 5, 2012 blog post. We are now seeing a setup suggesting excessive pessimism. Tuesday was the fifth day in a row that SPY closed in the lower half of its daily range. The study below was shown in the 12/20/11 subscriber letter (and again last night). It examines 1-day returns following similar strings of poor closes.
The numbers here appear to be strongly compelling and indicate a possible upside edge for Wednesday.
Also, a reminder to readers that I will be speaking at the Las Vegas Traders Expo on Saturday. In my talk I will be sharing a lot of my favorite overnight research. I look forward to meeting several of you!
Bad breadth on an up day is something that has been shown to lead to bearish inclinations in the past. On Monday, according to my data provider, the SPX closed up while the NYSE Up Volume % came in at 44.7%. This triggered the below study, which I last showed way back on 3/31/10 in the Subscriber Letter. I have updated the results.
As you can see the numbers are strongly bearish. But there are some caveats to consider today. SPX barely closed below its 200ma. It also barely closed positive on Monday. And the NYSE Up Volume % was only barely below 45%. Therefore, while all of the criteria were met to trigger the study, the fact that they were just barley met suggests Monday’s setup is not typical of the rest of the sample. So the reaction may not be typical either. Still, the fact that it did trigger suggests a move lower is possible and bulls should be on the alert.
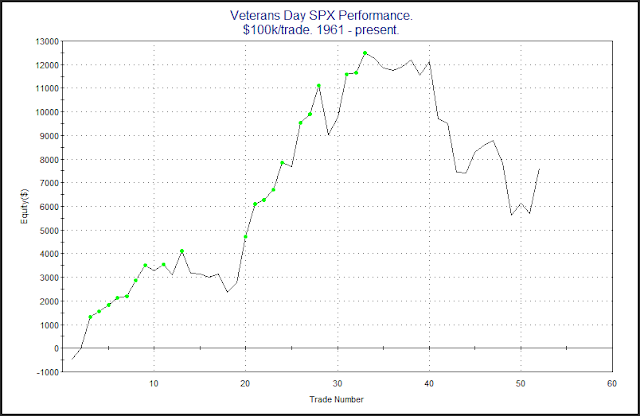
Veterans Day is one of the few US holidays when the bond market is closed and the stock market is open. Columbus Day is another. But while Columbus Day has exhibited some quantifiable edges, Veterans Day has not. (At least none that I have identified and feel confident about.) Veterans Day is celebrated on November 11th (or the closest weekday to November 11th) each year. For a brief period from 1971 – 1977 it was celebrated on the 4th Monday of October. Below is a profit curve that shows how Veterans Day has performed over the years.
While for a good long while it appeared Veterans Day may provide an upside edge, the curve topped out in 1992. Since then it has been mostly lower. Happy Veterans Day and thanks to all veterans!
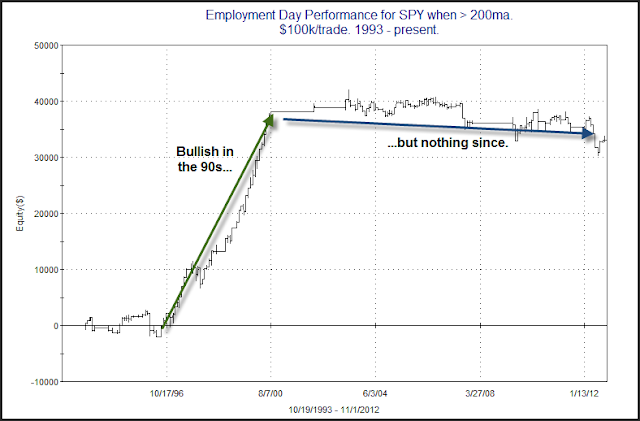
Employment days have an interesting history and they have contributed to some worthwhile studies over the years. By “Employment Day” I mean days that the Federal Employment Report will be released. This occurs once per month and is normally on the 1st Friday of the month. Below is a chart of SPY performance on Employment Days during bull market environments. Each trade was a fictional $100k.
What I find so interesting about the chart is that for a long time Employment Days in uptrends showed a strong propensity for gains. But in 2000 this edge vanished. Since then there has been no apparent advantage – bullish or bearish. While it’s unusual to see such an abrupt change in market dynamics, it does serve as a nice reminder that such changes are always possible.
In last night’s letter I examined 20-day lows that occur on Fed Days during long-term uptrends. The results appeared interesting. You’ll find the stats table below.
Over the first 1-4 day period there doesn’t appear to be much of an edge. But over the 5-10 day period the market has reliably risen. Instances are low, but I still thought the two-week results were strong enough to keep in mind and give some consideration.
The pre-market indications are for a gap down of about 1% as I write this around 8:20am EST. With tomorrow being a Fed Day I decided to see how the market has performed other times it has seen large gaps down on the day prior to a Fed Day. This first study looks at performance from open to close on the day of the gap down.
Note that the only instance that did NOT gap down at least 1% was the last one on 12/12/11. Instances are low. Initial returns are mixed with a mild bearish tilt.
Now let’s see what happens if we hold through the Fed Day.
Here we see a big turnaround. All the 1% gaps down turned net positive from their opens. And the only instance not to see a gain of greater than 1% on the Fed Day was the last one (which gapped down less than the others to start). It added to its day 1 losses.