This Pattern Suggests We Could See More Upside In The Next Few Days

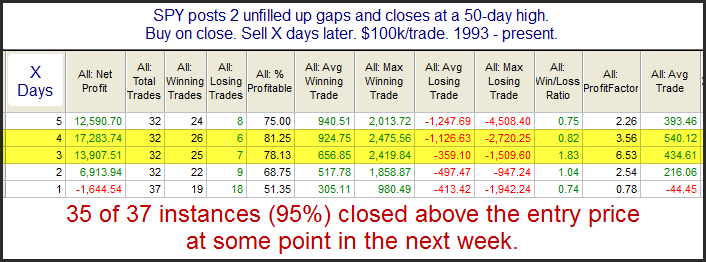
Short-term strength is often followed by short-term weakness, but when that short-term strength is unusually impressive, it can create a situation where that extreme strength will beget more strength. When the market leaves an unfilled up gap that is considered a sign of strength.  When it does it 2 days in a row and closes at a 50-day high, that can be considered exceptional strength. That is what happened on Friday, and it triggered the study below, which I last shared on the blog on 9/10/12.  All stats are updated to present day.

The size of the follow-through isn’t terribly large. But it has been very, very consistent that at least some follow through was achieved in the next few days.

What Happens After 6 Months Of Gains

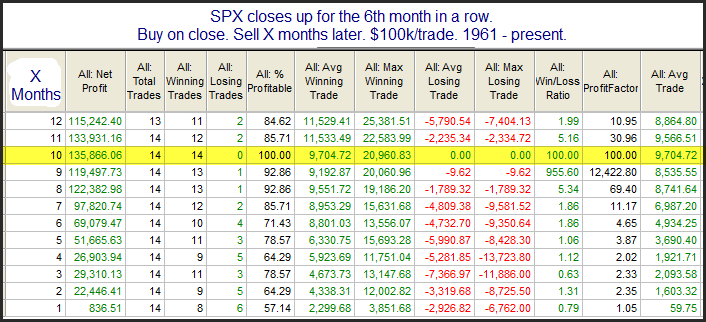
April marked the 6th month in a row that SPX has managed a positive close.  I have seen many analysts suggest this means the market is overextended and due to correct in the coming months.  So I decided to take a look for myself.  I ran a study to examine past performance following 6 consecutive months of gains.

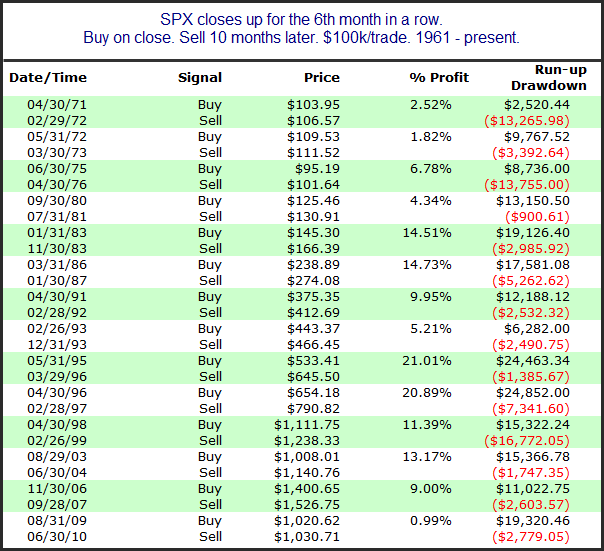
The 1st month out of the gate looks to have about breakeven odds.  After that everything points to the bullish case, with strongly positive stats across the board for the next 10 months or so.  In fact, 10 months out all 14 instances were higher.  Below I have listed the 14 instances.

Some strong results here.  Based on this, it appears that the bulls should be celebrating that 6-month rally, rather than the bears trying to use it as evidence for an overdue pullback.

Of course there has also been a lot discussed about “Sell in May” and the possible weak upcoming seasonality.  I did a detailed study on this in the intermediate-term section of the Subscriber Letter this past week.  If you would like to read it you may sign up for a free trial using the link below.

https://quantifiableedges.com/members/register.php

The Impact Of A Breakaway Gap

In the 9/7/12 blog I looked at the short-term importance of an unfilled upside gap accompanying a breakout.  With yesterday’s breakout to a new closing high occurring along with an unfilled up gapI have revisited that study below.

Results here are strong across the board.

Now let’s look at instances where the 50-day high breakout was not accompanied by an unfilled gap.  Interestingly, the number of instances was nearly the same.  This study also appeared in the 9/7/12 blog.

As you can see these moves to new highs that don’t start with an unfilled gap are much less reliable over the short-term.

Technicians will often use the term “breakaway gap”.  This suggests the gap occurs on the same day as a base breakout.  The idea is that the new high causes excitement and the gap leaves a good amount of people sidelined or stuck short.  When it doesn’t immediately fill, it leads these people to chase and helps to propel the market even higher.

Interestingly, as I showed yesterday on Overnight Edges, breakaway gaps like this have not led to a positive overnight session.

What Recent Moves Up Suggests About The Pullback That Began On Friday

Strong, persistent moves often do not roll over immediately.  Real persistency can set up a situation where strength begets more strength.  An example of that concept was triggered with Friday’s setup, where we had the 1st down day after 5 consecutive higher closes.

Initially there appears to be a moderate inclination for a bounce.  Once you get out 9-10 days the upside edge appears very substantial.  Based on this, there appears a good chance that the dip that started Friday may not get too far before the market again moves higher.

When SPX & VIX Both Rise For The 2nd Consecutive Day

I am looking at a mix of bullish and bearish studies right now.  One indicator arguing for the bears is the VIX.  The VIX is a measure of volatility and it typically moves counter to the SPX.  So it will most often rise when the SPX moves down and it will drop when SPX rallies.  Yesterday both the SPX and the VIX closed higher.  And they did so for the 2nd day in a row.  The study below is an old one that looks at other times this has occurred and the market is in a long-term uptrend.  All results are updated.

While not overwhelming, the numbers here provide the bears some hope over the next 1-2 days.

A Volatility Contraction During A Strong Bounce, And What Has Followed Historically

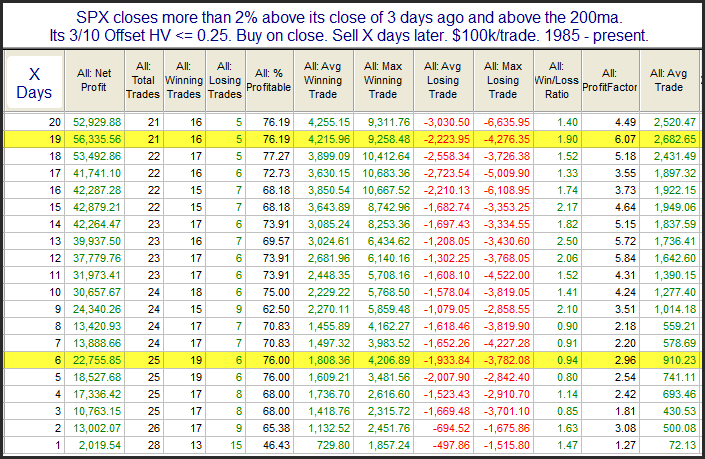
In July of 2009 I introduced the 3/10 Offset HV indicator.  It essentially takes a short 3-day measure of Historical Volatility and compares that to the 10-day measure of 3-days ago.  Low readings indicate there has been a contraction in volatility.  High readings indicate there has been an expansion.  Anything at or below 0.25 is regarded as extremely low.  Often after sharp contractions we see a volatility expansion take place.  

On Tuesday the 3/10 Offset HV for SPX came in at just 0.22.  I found it particularly odd that the 3/10 Offset HV was so low considering we’ve seen a fairly strong move higher over the last three days. Wondering whether that meant downside risk is now greatly increased, I ran a study.


I found it quite interesting that the numbers here all seem to suggest an upside edge. I suppose to get the 3/10 Offset HV indicator that low while the market is rising so strongly would require some volatile activity prior to the bounce. Being above the 200ma, that scary, volatile period will often pave the way for a continuation of the rally.

What The Last 2 Days Unfilled Gaps May Be Suggesting

I am seeing a real mix of evidence right now, as neither bullish nor bearish short-term evidence is dominating.  The study below is one example of a study from last night’s letter with possible bearish implications. It examines 2-day moves like SPY has just encountered.

The suggestion here is that more downside appears likely over the next few days.

Happy Tax Day!

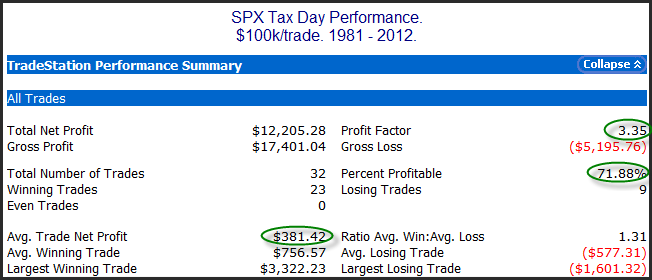
Today is the day taxes are due in the U.S.  The reason tax day may be important is that it is the last day that people can make IRA contributions to count for the previous tax year.  This can create a last-minute rush and you will often have an inflow of funds heading into the market right around and on April 15th.  Fund managers will often put this money to work immediately and it creates a positive bias for the market.  Tax Day itself seems to have benefited over the years.  Below are some stats that demonstrate this.

What Has Followed Large Unfilled Employment Day Gaps Down

Employment Days will often occur in conjunction with a strong price move because the employment report is frequently viewed as an important piece of economic data. Still, it has been quite rare to see the employment report lead to a large gap down that never fills during the day. This happened on Friday.  When it has occurred in the past selling has generally continued into the next trading session. This is something I last showed in the 9/6/11 subscriber letter. An updated list of all instances is below.


Since the beginning of 1997 not only have all instances closed negative, but intraday drawdown has been larger than intraday run-up in every case.  Traders may want to keep this in mind today.  (Of course fighting against this is the recent tendency of the SPX to change direction every day.  An up close Monday would mark the 13th day in a row that SPX has changed direction, leaving the streak as the single longest ever – it is currently tied with a 1994 streak at 12.)

 As usual, it should be an interesting day..

When Large Caps Hold Up Relatively Well On A Decline From A High

Large-caps definitely held up better than the rest of the market on Monday.  Coming from a 50-day high, this caused the study below to trigger.  It was last seen in the 9/18/12 letter.  Stats are all updated.

The implication here is that when the SPX is coming off a high level and it holds up relatively well despite broad selling, it will often have further to drop.  The selling in the broad market could spill over into the large caps.  There’s a chance they could even play catch-up to the downside.  The good news for bulls here is that the bearish inclinations have only lasted a couple of days.

An Intraday Look At Holy Thursday Historical Performance

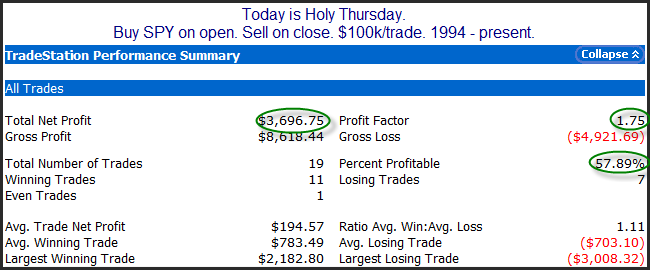
Last year I showed that the Thursday before Easter (also known as Holy Thursday) has exhibited a bullish inclination over the years.  Today I thought it would be interesting to break out that performance by overnight vs. intraday returns.  Intraday returns will be shown here.  Overnight returns can be found on Overnight Edges.

The study below shows historical performance from open to close on Holy Thursday.

Numbers here are solidly bullish, though not as overwhelming as the total numbers would suggest.  This is thanks to much of the strength coming the night before.  Below is the list of instances.


Instances highlighted in purple are the 5 that started with a gap down.  All 5 of these gaps were filled at one point during the day, and all 5 instances saw SPY close above where it opened (with 2 of them making for the largest 2 gains of the 19 listed).

There are numerous ways to try and take advantage of this information.  In general, traders should be aware that Holy Thursday has exhibited seasonal strength, and that strength has often begun to exert itself the night before.  For a more detailed breakdown of the overnight returns, check out today’s Overnight Edges blog post.

An Unusual And Potentially (Short-Term) Bearish Inside Day

Yesterday was interesting and unusual because it posted an unfilled gap up and a close above the open, but still finished as an inside day.  This triggered the below study in the Quantifinder.

Implications are somewhat bearish for a 1-day time frame.  I also discussed this setup in the subscriber letters over the weekend, because not only did it trigger yesterday, but also it triggered on Friday.

A Fed Day Setup That Has Seen SPX Higher 3 Days Later Every Time Since 1982

Tuesday’s decline was the 3rd down day in a row.  Many people are now aware that Fed Days have historically had a bullish tilt.  So 3-day selloffs leading up to Fed Days have been quite rare.  But they have also been a very bullish setup.  The table below shows the hypothetical results of buying at the close on the day before a Fed Day if it was at least the 3rd consecutive lower close.  The exit is 3 days later.

All of the 15 instances saw the market higher 3 days later.  These are some very encouraging numbers for the bulls.  I do have a concern here.  There has only been 1 instance in nearly 15 years.  And that took place in 2005.  The setup has certainly been potent over a long period of time.  But I am much less enthused about it than I would be if all these instances would have taken place over the last 10 years.  Still, with an undefeated record I think it is worth consideration.

The 1st Short-Term Closing Low In A While

The market had gone quite a while without a pullback before the last 2 days.  Monday, for the 1st time in a while, SPY closed at a 5-day low.  The study below looks at at other instances of SPY closing at a 5-day low after going at least 2 weeks without one.

Results here suggest a decent upside edge.

Large Gaps Down When The Market Was Near A Long-Term High

It looks like we should see some strong action on Monday.  News out of Cyprus has S&P futures down about 1.5% as I type this late at night.  I decided to look back at other times that SPY was trading near a 200-day high and then gapped down over 1% overnight.

There have not been a whole lot of instances, but early indications suggest there could be more selling after the open.  Below is a list of all the instances.

November 2009 was the only instance that put in much of a gain.  And even that one failed to fill it gap at any point during the day.  None of the others even bounced back as much as 0.6% on an intraday basis.  If the market does open as weak as it appears it may at this point, then chances of a strong upside reversal don’t appear very good.