In July of 2009 I introduced the 3/10 Offset HV indicator. It essentially takes a short 3-day measure of Historical Volatility and compares that to the 10-day measure of 3-days ago. Low readings indicate there has been a contraction in volatility. High readings indicate there has been an expansion. Anything at or below 0.25 is regarded as extremely low. Often after sharp contractions we see a volatility expansion take place.
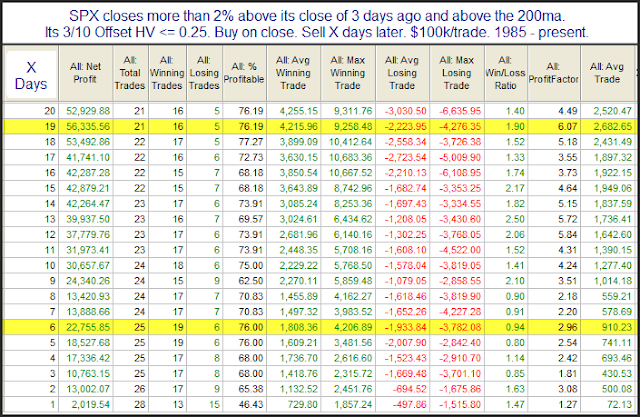
On Tuesday the 3/10 Offset HV for SPX came in at just 0.22. I found it particularly odd that the 3/10 Offset HV was so low considering we’ve seen a fairly strong move higher over the last three days. Wondering whether that meant downside risk is now greatly increased, I ran a study.
I found it quite interesting that the numbers here all seem to suggest an upside edge. I suppose to get the 3/10 Offset HV indicator that low while the market is rising so strongly would require some volatile activity prior to the bounce. Being above the 200ma, that scary, volatile period will often pave the way for a continuation of the rally.

