October Opex Week Historically Bullish

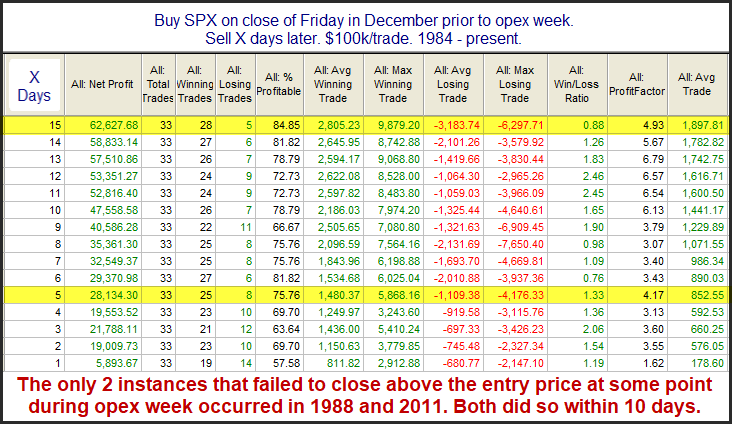
Option expiration week is often a pretty good week for the market. October is one of those months where it has been especially good over the years. This can be seen in the study below.

2017-10-16

I decided to exclude 2008 because action that week was such an incredible outlier that it greatly skewed all the stats. (The week started with an 11.5% gain on Monday of 2008.) Even without 2008, results 1-4 days out look pretty solid.
Want research like this delivered directly to your inbox on a timely basis? Sign up for the Quantifiable Edges Email List.

The Persistent Move Higher In The Russell 2000

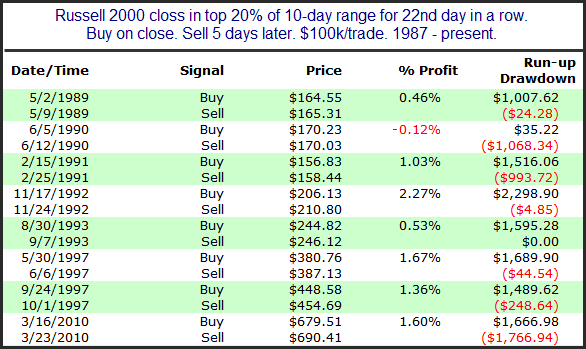
The persistency of the move higher is very impressive. For instance, the Russell 2000 has now finished in the top 20% of its moving 10-day range for 22 trading days in a row. That is over a month. I looked back at other times this has happened. Below is a list of all prior instances and their 5-day returns.

2017-10-11

It is an impressive list, with the only loser being very small. But with only 1 instance in the last 20 years, it is tough to read too much into the results. Still, it does underline the fact that the Russell’s move is quite impressive, and it is showing persistency that has rarely been seen since the 90s.

 
Want research like this delivered directly to your inbox on a timely basis? Sign up for the Quantifiable Edges Email List.

When Months Finish At A High

Turn of the month will often trigger some seasonal studies. The study below looks at performance after times that SPY has closed a month at the highest closing price of the month.

2017-10-02 image1

The numbers across the board are fairly compelling. Trades may want to keep this in mind as we enter October.


Want research like this delivered directly to your inbox on a timely basis? Sign up for the Quantifiable Edges Email List.

The Weakest Week (Updated)

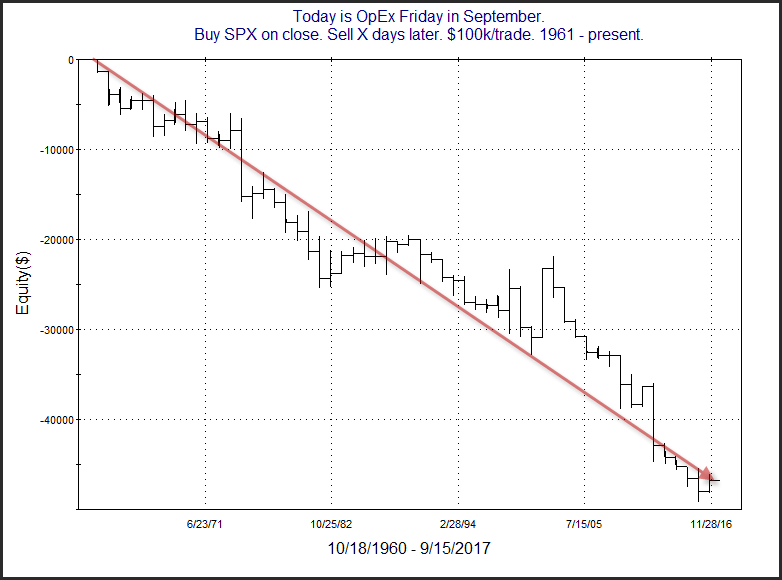
From a seasonality standpoint, there isn’t a more reliable time of the year to have a selloff than this upcoming week. In the past I have referred to is as “The Weakest Week”. Since 1961 the week following the 3rd Friday in September has produced the most bearish results of any week. Below is a graphic to show how this upcoming week has played out over time.

2017-09-17 image1

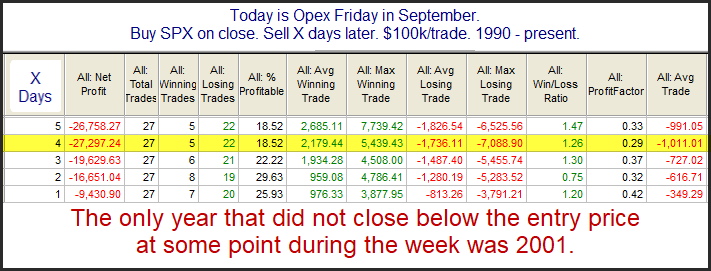
As you can see the bearish tendency has been pretty consistent over the last 56 years. There was a stretch in the late 80’s where there was a series of mild up years. Since 1990 it has been pretty much all downhill. Below is a table showing results of buying Sept. op-ex Friday and then selling X days later from 1990 – 2016.

2017-09-17 image2

The consistency and net results appear quite strong. I note the only instance that didn’t post a lower close at some point during the following week was in 2001. And the 9/11 attacks certainly made for unusual circumstances that year.


Want research like this delivered directly to your inbox on a timely basis? Sign up for the Quantifiable Edges Email List.

Two Unfilled Gaps Up & A 50-Day High

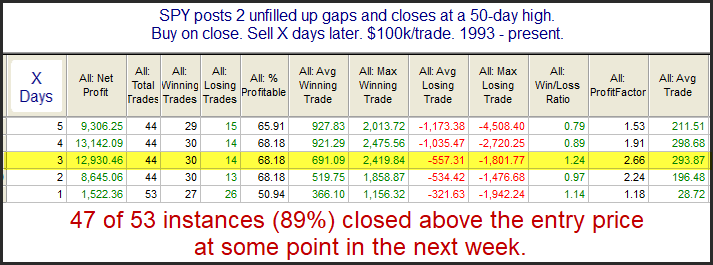
It is notable that Wednesday was the 2nd day in a row with an unfilled up gap. The study below appeared in the Quantifinder last night, and has been updated with current stats. It examined other times SPY left 2 unfilled up gaps and closed at a 50-day high.

2017-09-13

The size of the follow-through isn’t terribly large, but it has been quite consistent that some follow through was achieved in the next few days. This suggests the current momentum may be followed by further short-term gains.


Want research like this delivered directly to your inbox on a timely basis? Sign up for the Quantifiable Edges Email List.

A Look At Historical Post-Labor Day SPX Performance

Way back in 2009 I showed a study that suggested Labor Day week performance has been somewhat dependent on whether the market has rallied over the 20 trading days leading up to it. I decided to take a new look at that study today. Below are updated results of post-Labor Day action when the previous 20 days have seen gains versus losses.

2017-09-04-1

This shows a poor performance record when there has been a rise in the market. But in 2017 SPX has posted a slight decline over the last 20 days. So we are facing the below scenario.

2017-09-04-2

Just the opposite here. The market appears to lean towards gains during Labor Day week under such circumstances. Of course there are a few caveats to keep in mind. For one, instances are a bit low. Secondly, while we are down over the 20-day period it is not by much, and with SPX up the last 6 days in a row, any “oversold” edge here may not be in place. Still, the results do give us some information to consider as we head back to work on Tuesday.


Want research like this delivered directly to your inbox on a timely basis? Sign up for the Quantifiable Edges Email List.

Why Today’s Fed Day Setup May Not Be As Bullish As Most

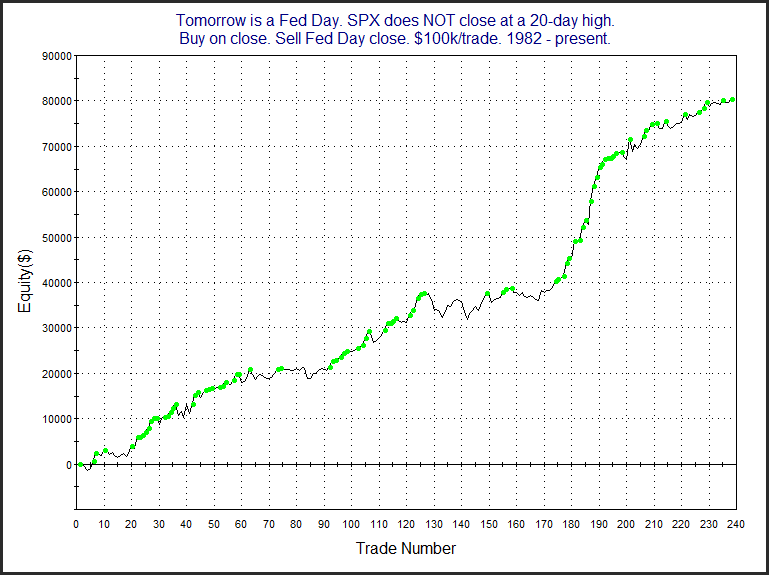
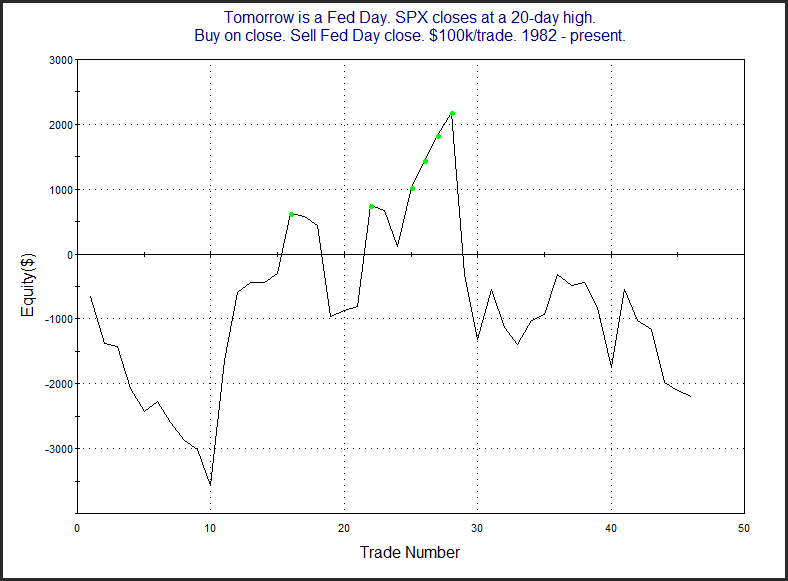
Wednesday is a Fed Day. Fed Days have historically shown an upside tendency. I have documented this tendency in great detail over the years, with the most complete documentation coming in The Quantifiable Edges Guide to Fed Days. Based on what the market did Tuesday, this does not seem to be the most favorable Fed Day setup. A big reason for this is that SPX closed at a 20-day high on Tuesday. Fed Day bullishness has often occurred when a Fed announcement has helped to alleviate market stress. When the market closes at a 20-day high, it typically means there isn’t a lot of worry present. Under these circumstances, the upside inclination has also not been present. Below are charts that compare Fed Days that close below 20-day highs to those that close at 20-day highs.

2017-07-26-1


2017-07-26-2

The new high on Tuesday appears to eliminate, or greatly reduce, the bullish Fed Day edge.


Want research like this delivered directly to your inbox on a timely basis? Sign up for the Quantifiable Edges Email List.

Worldwide Generosity from Quantifiable Edges Readers

As many readers of this blog are aware, on Saturday I will be doing a 175 mile bike ride from Boston, MA around Cape Cod to its tip in Provincetown for the Multiple Sclerosis Society. I have offered anyone that donates any amount of money a copy of the QE Fed Day MS Ride package, which includes a pdf copy of the Quantifiable Edges Guide to Fed Days, along with Fed Day code to allow people to create their own studies.


To date, 30 Quantifiable Edges readers have donated a total of $1094, which I am very thankful for. Donations have ranged from $5 to $100. And what really struck me when I looked at the list was where the donations have come from. MS is worldwide issue, and so far we have seen donations come from 10 countries on 4 continents! They are USA, Canada, Australia, Germany, Ireland, United Kingdom, Israel, Netherlands, and South Korea!  Thanks to all!


The ride is on Saturday & Sunday, so there is a little more time to get your donations in an take advantage of the Bike MS Fed Day offer!


Here again is the process…


1) Go to my personal fund raising page:

https://main.nationalmssociety.org/goto/robridesreallyfast


2) Make a donation of any size (but feel free to be generous!). Note: The MS donation page makes it look like the min amount is $35. But you can click the “other amount” button on the right and enter whatever amount you feel appropriate. Even small gifts are greatly appreciated!


3) Send an email to support@quantifiableedges.com with your receipt from the MS Society, and within 24 hours we will send you the above Quantifiable Edge Fed Day MS Ride package. (If you don’t receive it in 24 hours, feel free to send us a 2nd email, because that means we likely missed the 1st one, or post a comment below letting us know we somehow missed it!)


And once again, here is what you will receive…

  1. The Quantifiable Edges Guide to Fed Days (pdf version)
  2. My Tradesation “Fed Day” code that show every Fed Day and the day before from 1982 – 2017.
  3. Text file versions of the code in case you do not use Tradesation, but still want the full list of dates, or to translate the code into another program for your own testing.

Note that the code has never before been offered with the book. So even if you already have the book – make a donation and get the code!


Thanks for all your support!


(I will be tweeting updates during the ride, so you can see how far I am getting throughout the day.)
Historical Performance of Fed Days Broken Down by Sector

Last night I ran a study that I have never published before with regards to Fed Days. It looked at the performance of each Sector ETF on Fed Days to see which ones performed the best and which ones disappointed. The study can be found below.


2017-06-13

First, I did find it interesting that every sector has shown positive Fed Day performance.  But since 2000 both Materials and Financials have posted outsized gains on Fed Days, and done so with strong consistency. Meanwhile, Consumer Staples and Utilities have lagged behind the rest of the pack.

For more Fed Day research, please check out QE’s very special that will provide our best collection of Fed Day studies and well as code to help you study Fed Days on your own, all for just donating to the Multiple Sclerosis Society. Details here.


Want research like this delivered directly to your inbox on a timely basis? Sign up for the Quantifiable Edges Email List.

This Study Suggests Intermediate-Term Momentum Is Strong Enough To Persist A While Longer

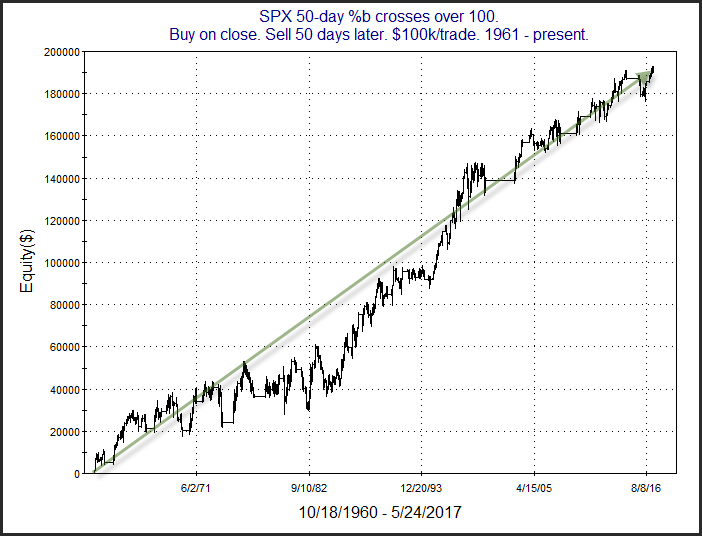
One study from the Quantifinder that triggered last has some potential intermediate-term implications, and it is fairly interesting, so I figured I would share it. This study looked at the SPX closing price in relation to its 50-day Bollinger Bands, and the fact that we are now extended upwards. I used 2 standard deviations in the Bollinger Band calculation. I used %b to measure where we fell. For those unaware %b simply measures the distance between the 2 bands. So a reading of 0 means price is right at the lower band. A reading of 100 is right at the upper band. A reading of 50 would be right at the moving average being used – in this case the 50ma. So a move 2 standard deviations above the 50ma would be a %b reading of 100.

When I looked out over the next 5 – 50 days, results all appeared fairly bullish. They suggested that the kind of strong momentum that would lead SPX to close above its 50-day Bollinger Band favored more upside over a possible reversal. Below is a profit curve showing how the setup would have played out from 1961 – present.


2017-06-02

The positive slope over such a long period is encouraging. Generally, such extended conditions like we are currently seeing have exhibited enough strength that they were more likely to lead to more strength than to weakness. We could see the current momentum persist a bit longer.


Help me make the Quantifiable Edges Bike-MS Fund Raising Drive a success and take advantage of a very special offer on our Fed Day research! Click here for details!


Want research like this delivered directly to your inbox on a timely basis? Sign up for the Quantifiable Edges Email List.

Bullish History of Thursday After Memorial Day (updated)

Thursday after Memorial Day has been a day that has exhibited a bullish bias for many years. I last showed this on the blog about 3 years ago. The chart below shows updated results.


2017-06-01

Single-day seasonality can certainly be overrun by other forces, but the Thursday after Memorial Day has been a good one for many years, and that may be something that traders want to consider today.


Help me make the Quantifiable Edges Bike-MS Fund Raising Drive a success and take advantage of a very special offer on our Fed Day research! Click here for details!


Want research like this delivered directly to your inbox on a timely basis? Sign up for the Quantifiable Edges Email List.

SPX Dips After Persistent Move To A New High – What’s the Next Move?

One compelling study that triggered tonight suggested the recent persistent upmove is unlikely to abruptly end. (This is a theme we have seen many times over the years.) It considers what happens after SPX moves up at least 5 days in a row to a 50-day high, and then pulls back. (This is the current setup.)


2017-05-31

We see here a decent edge that becomes stronger and more consistent as you look out over the next several days. The 9-10 day time frame shows exceptional stats. The 2-day timeframe suggests a short-term boost is also likely.


Help me make the Quantifiable Edges Bike-MS Fund Raising Drive a success and take advantage of a very special offer on our Fed Day research!  Click here for details!


Want research like this delivered directly to your inbox on a timely basis? Sign up for the Quantifiable Edges Email List.

Get Fed Day Research & Tools While Helping Fight Multiple Sclerosis (MS)!

Quantifiable Edges is now offering our Fed Day research and tools to anyone that makes any size donation to the MS Society! Keep reading for details.


One bit of research that Quantifiable Edges has become known for are the many studies I have published on Fed Days. In fact, you could say I wrote the book on Fed Days. And the pdf version of that book sells for $25. But between now and June 24th I will send you a zip file containing the following if you make any size donation to my MS fund raiser page.

  1. The Quantifiable Edges Guide to Fed Days (pdf version)
  2. My Tradesation “Fed Day” code that show every Fed Day and the day before from 1982 – 2017.
  3. Text file versions of the code in case you do not use Tradesation, but still want the full list of dates, or to translate the code into another program for your own testing.

Note that the code has never before been offered with the book. So even if you already have the book – make a donation and get the code!


Why?

About a year and a half ago, my college roommate, and one of my dearest friends, was diagnosed with MS. He decided to raise money this year by doing the Bike MS challenge – a 175 mile, 2-day bike race that goes from just south of Boston down to and all the way around Cape Cod. So I bought a bike and decided to do it with him. I’ll figure out how to pedal it for 175 miles, but I need your help in fundraising efforts!


The Process:

1) Go to my personal fund raising page:

https://main.nationalmssociety.org/goto/robridesreallyfast


2) Make a donation of any size (but feel free to be generous!).  Note: The MS donation page makes it look like the min amount is $35.  But you can click the “other amount” button on the right and enter whatever amount you feel appropriate.  Even small gifts are greatly appreciated!


3) Send an email to support@quantifiableedges.com with your receipt from the MS Society, and within 24 hours we will send you the above Quantifiable Edge Fed Day MS Ride package. (If you don’t receive it in 24 hours, feel free to send us a 2nd email, because that means we likely missed the 1st one, or post a comment below letting us know we somehow missed it!)


Thanks for your support and generosity! I hope the Quantifiable Edges Fed Day MS Ride package will pay you back your donation size and much more in your trading accounts!  And I hope together we can make a big positive difference in the fight against MS!


Why Tuesday’s 20-day High Mutes Today’s Fed Day Potential

Wednesday is a Fed Day. Fed Days have historically shown an upside tendency. I have documented this tendency in great detail over the years, with the most complete documentation coming in The Quantifiable Edges Guide to Fed Days. Based on what the market did Tuesday, this does not seem to be the most favorable Fed Day setup. A big reason for this is that SPX closed at a 20-day high on Tuesday. Fed Day bullishness has often occurred when a Fed announcement has helped to alleviate market stress. When the market closes at a 20-day high, it typically means there isn’t a lot of worry present. Under these circumstances, the upside inclination has also not been present. This can be seen in the study below.


2017-05-03

2017-05-03-2

Neither the stats table nor the profit curve suggest any consistency or tradable edge. As a comparison, here is a profit curve of all Fed Days when SPX did NOT close at a 20-day high the day before.


2017-05-03-3


Want research like this delivered directly to your inbox on a timely basis? Sign up for the Quantifiable Edges Email List.

Holy Bullish Thursday!

Below is a quick look at how the SPX has performed in the past on Holy Thursday. Like the last day before many long weekends, it has shown a bullish propensity over the years.

2017-04-13

The numbers are compelling, and it is especially impressive to see how much the winners have outsized the losers.


Want research like this delivered directly to your inbox on a timely basis? Sign up for the Quantifiable Edges Email List.