
The persistency of the move higher is very impressive. For instance, the Russell 2000 has now finished in the top 20% of its moving 10-day range for 22 trading days in a row. That is over a month. I looked back at other times this has happened. Below is a list of all prior instances and their 5-day returns.
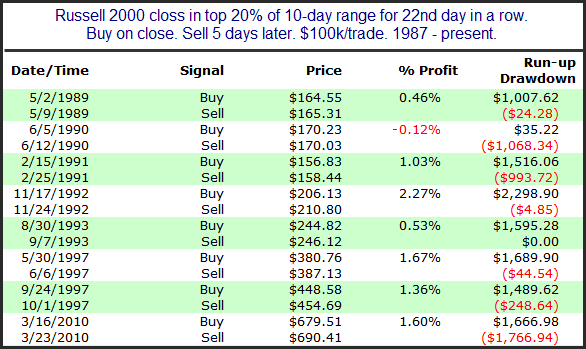
It is an impressive list, with the only loser being very small. But with only 1 instance in the last 20 years, it is tough to read too much into the results. Still, it does underline the fact that the Russell’s move is quite impressive, and it is showing persistency that has rarely been seen since the 90s.
Want research like this delivered directly to your inbox on a timely basis? Sign up for the Quantifiable Edges Email List.
