On Monday the SPY closed at a 50-day low for the 1st time since the beginning of October – just over 150 trading days ago. Not only is it at an intermediate-term low, it is strongly oversold on a short-term basis based on several measures. Many traders are therefore looking for a bounce.
Strong bounces from intermediate-term lows are often initiated by a large move overnight. Big gaps in overnight action will often create strong emotion at the open and can help to spark a bottom (at least a temporary bottom). To illustrate my point the study below looks at 3 scenarios. Each scenario shows results of buying at the open the day after a 50-day closing low and selling at the close. The only filter I use to distinguish is the size of the opening gap.
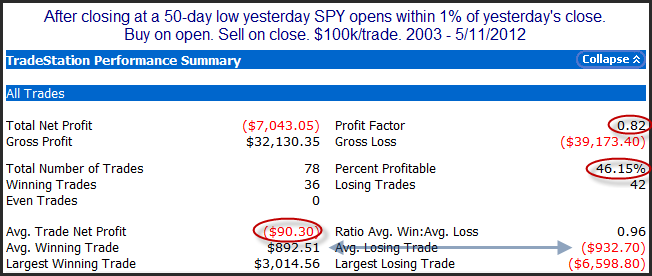
Let’s first look at small (or non-existent) gaps.
Results here appear weakly bearish. This isn’t very surprising considering the market is obviously downtrending if it is making 50-day lows.
But now let’s see what happens when SPY gaps down over 1%.
Much more volatility among both winners and losers. More often than not the emotion has at least temporarily washed out the selling and the net results have been solid intraday gains.
Now let’s look at results if the market gaps up over 1%.
Here again we seen bulls have won out a little more often than bears. Like the last scenario the big gap serves to increase volatility in both winners and losers, and the net results show strong intraday gains for the bulls. In this case the upside edge is not due to a “washout” of selling, but more likely it is panic buying as those that were short overnight are afraid that the market is going to run away from them – so they rush to cover, creating what is often referred to as a short-covering rally.
In either case, when trading at new lows, the emotion generated by a large opening gap can often ignite a flurry of price movement that is not seen following small overnight moves. More often, but not to an overwhelming degree, that flurry of price movement will result in strong intraday gains. This is why I become more interested in buying emotional opens following new lows than I do when the market opens flat.