What The 2-day Gap Pattern In SPY Suggests For The Next Few Days

Unfilled gaps can be a signal of strength in the direction of the gap.  But when they are quickly reversed by a sign of weakness that can suggest the first move was false.  Friday’s unfilled gap up in SPY was a sign of strength.  Monday’s unfilled gap down was a sign of weakness.  This suggests Friday’s move was false.  Unfilled gaps down that directly follow unfilled gaps up have historically led to further short-term weakness.  This can be seen in the study below.

The edge has primarily play out over the next 3 days.  Of course with AAPL earnings, Wednesday’s Fed Day, and European news flows there are a lot of outside forces that could impact the market over the next few days.  But the action over the last 2 days will likely weigh on the market.

In last night’s Subscriber Letter I showed this study with an additional filter that suggested an even greater downside edge.  If you have never trialed Quantifiable Edges before, go here to sign up for a free 1-week trial.  You’ll be able to see that letter.  If it has been more than 9 months since your last trial and you would like another one, simply send an email to: support @ QuantifiableEdges .com (no spaces) with a request and I’ll set you up.

Related Quantifiable Edges Studies

SOX Closes Up Despite the Strong Drop in the NDX

Two weeks ago I showed how a negative SOX on a day when the NDX is strong can suggest bearish implications for the short-term.

Last night Johan, a frequent reader, observed that the reverse had occurred (NDX down over 1% while SOX was up).  He wondered what the implications of that might be.  It stoked my curiosity as well.  So I took a look.

Moves higher have strongly outsized moves lower, but the consistency has not been great – just a little over 50/50.  So I am not sure I would label this as “bullish”, but it provides some hope for the bulls and is certainly better than the alternative we looked at a couple of weeks ago.

The Market Avoided This Bearish Daytrade Setup By Seconds

On March 2 I discussed a setup in which the NYSE TICK manages to trade above 0 for the entire 1st 30 minutes of the trading day.  Such a setup used to suggest bullish implications, but that no longer appeared to be the case.

I also have an old study that looks at the other side of the coin.  What if TICK goes the 1st 30 minutes and trades BELOW 0 the whole time?  This NEARLY triggered this morning.  The TICK managed to move up through 0 in the 30th minute.  But let’s take a look at it anyway.

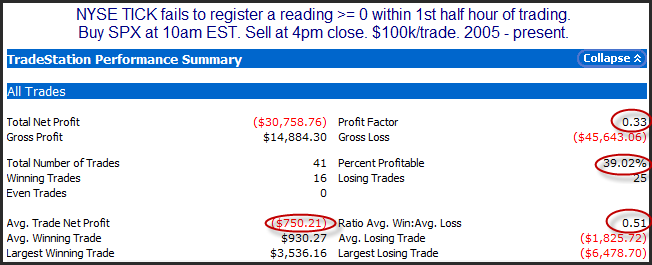
In the past I have shown this to suggest bearish implications.  Here is an updated look at those statistics:

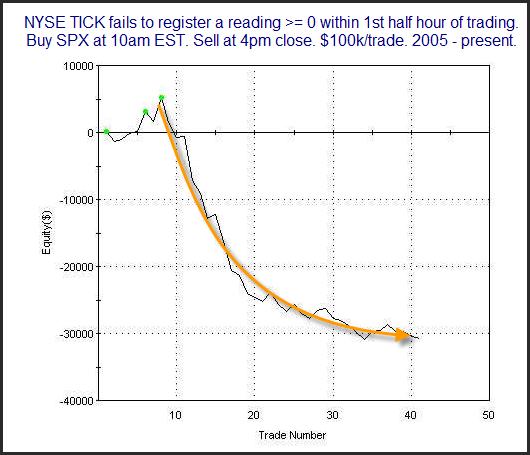
Everything here still suggests bearish implications.  An average loss of an “additional” 0.75% between 10ma and 4pm is quite large.  But let’s take a look at the equity curve to see how the edge has played out over time.

While recent instances have not been as powerful as some we saw in the past, the downside still appears to be intact.  It may be waning, but it still appears prevalent enough to raise a red flag.

So did we narrowly miss a bearish setup, setting the stage for an intraday rebound?  Or was this one close enough that the bears are likely to remain in control the rest of the day?  We’ll find out in a few hours…

Holy Thursday!

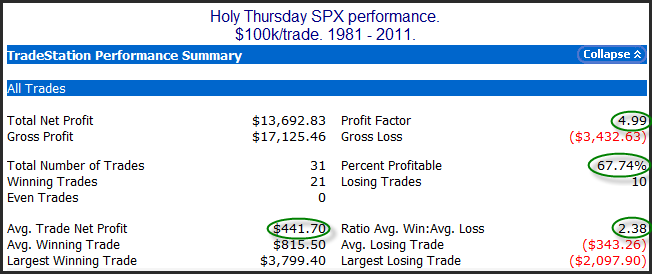
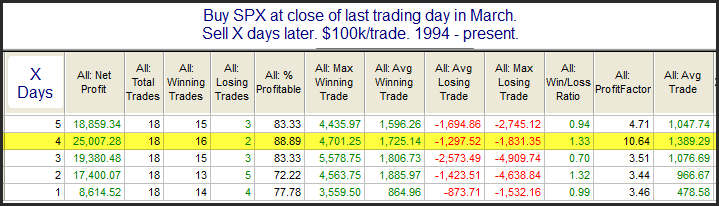
Below is a quick look at how the SPX has performed in the past on Holy Thursday. Like the last day before many long weekends, it has shown a bullish propensity over the years.

The numbers are compelling, and it is especially impressive to see how much the winners have outsized the losers.

What the SOX is Suggesting About the Short-Term Direction of the NDX

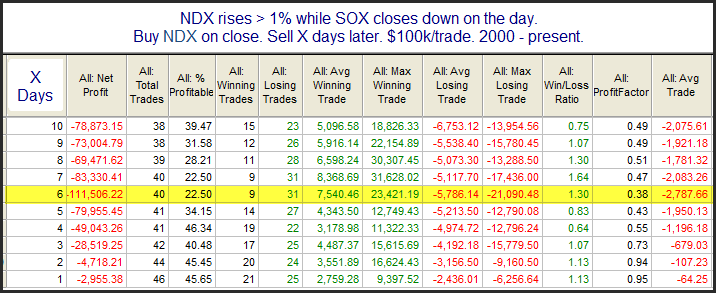
One interesting aspect of Monday’s trading was the discrepancy between the NDX and the SOX. While the NDX rose 1.1% on Monday, the SOX declined slightly – which is unusual action. Typically, such action has been followed by weakness in the NDX. This is demonstrated by a study last seen in the 9/9/10 Subscriber Letter, which I have updated below.

Six days out 78% of the instances were losers and the average occurrence was nearly a 3% loss. That seems to be a fairly substantial edge.

The Strong Edge Suggested By Similar Pullbacks In The Past

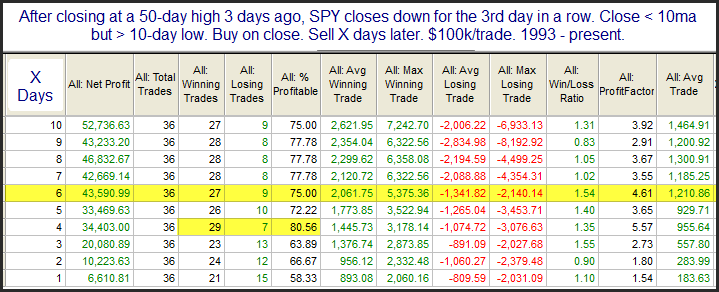
In last night’s letter I decided to look at other times where a 3-day pullback was coming off a 50-day high and was strong enough to put SPY below its 10ma, but not strong enough to make it close at a 10-day low. These filters seem to fairly represent the current situation, and the results were quite compelling.

Under these circumstances, it appears bounces have been both reliable and powerful.

A Compelling Sign Of Intermediate-Term Strength

Yesterday’s move to new highs was accompanied by very strong breadth. The Up Volume % on the NYSE came in at 91%. It is fairly unusual to see such strong breadth occur when the market is hitting an intermediate-term high. The results below show all non-overlapping instances of a 50-day SPX high with greater than 90% upside volume since 1970.

These results are very compelling. 100% winners (16 for 16) and the average instance closed up 5.8% when looking out 50 days. This appears to be a nice piece of evidence for the bull case.

When VIX is at an Intermediate-Term Low Right Before a Fed Day

The study below is one I mentioned on Twitter (https://twitter.com/qerob) yesterday. Often leading up to a Fed Day the VIX will rise as traders fret over what the Fed might say or do. Monday was one of those rare occasions where VIX closed at an intermediate-term low on the day before a Fed Day. Below are results of the 16 other times this has occurred.

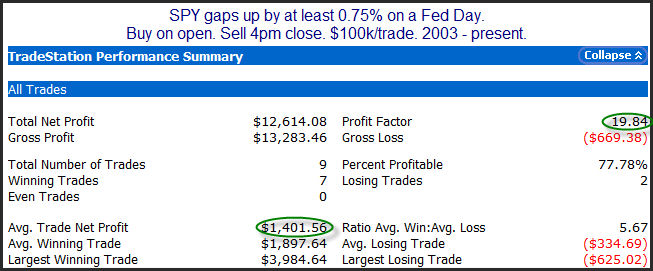
The average trade posted a loss of 0.05% – nearly breakeven. And the average run-up and average drawdown were both close to 0.7%. We know Fed Days have provided an upside edge over the years, but when the VIX has closed at an intermediate-term low, no edge has been apparent.

Reviewing Op-Ex Week Returns by Month

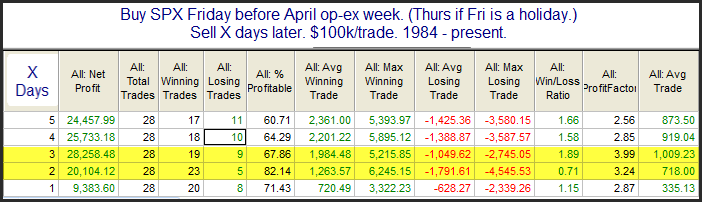
There is a possible seasonal influence that could have a bullish impact on the market this week. Op-ex week in general is pretty bullish. March, April, October, and December it has been especially so. S&P 500 options began trading in mid-1983. The table below is one I have showed on the blog the last couple of years in March. It goes back to 1984 and shows op-ex week performance broken down by month. All statistics are updated.

While December has been more reliable, total gains have been the largest during April and then March op-ex. Oddly, March, April, and December all saw down op-ex weeks in 2011. (October was up.)

The Link Between Junior High School Girls and Stock Market Bounces

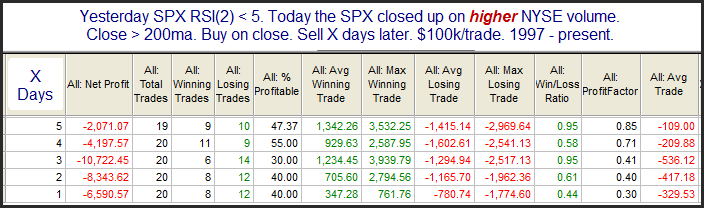
Below is a study I showed in last night’s Subscriber Letter (click here for a free 1-week trial). It considered volume’s impact on a short-term oversold bounce. It also utilized a long-term trend filter.

These results suggest there should be more upside to this bounce. Statistics across the board are impressive over the next week.

But does the low volume really matter? To answer this I ran the same study below but flipped the volume requirement and insisted volume come in higher.

Volume accompanying a move can signify enthusiasm for the direction of the move. Short-term oversold bounces sometimes remind me of junior high school girls. Back when I was in school, if you wanted a girl to like you then you had to make sure she didn’t think you liked her. Showing any enthusiasm would scare them off quickly. You had to play it cool, man. It appears that is what the bounce did Wednesday – it played it cool, man. And now it’s chances are better.

What Recent Closing TICK Values Are Saying About the Next Few Days

The study below considers the extremely low reading in the TICK TomOscillator. The TICK TomOscillator is an indicator that uses recent closing TICK values to determine buying and selling interest at the end of the day. It was developed by Tom McClellan. I’ve done some work with it and the name I use is one I made up. For those who would like to learn more about the TICK TomOscillator, the link below is a good place to start.

https://quantifiableedges.blogspot.com/2011/05/how-nyse-closing-tick-can-be-utilized.html

The study below looks for an extremely low reading in conjunction with a short-term oversold price condition during a long-term uptrend. It has been shown in the subscriber letter before and triggered again at Tuesday’s close.

There has been a strong propensity for the market to bounce over the next 2-3 days.

Does Turnaround Tuesday Apply to Shocking Gaps Down

Look like the SPY is going to open down more than it has dropped any single day so far in 2012.  This can be startling to market participants.  Many may be caught flatfooted.  Of course Tuesday is the #1 day to see a Turnaround.  But does it apply when the market gets a shock at the open?  I ran the test below to see.

It does not appear Tuesday give us a hig probability play.

I also ran the test on all days using a 20-day requirement instead of 10.  Similar non-edge.  Should be an interesting day…