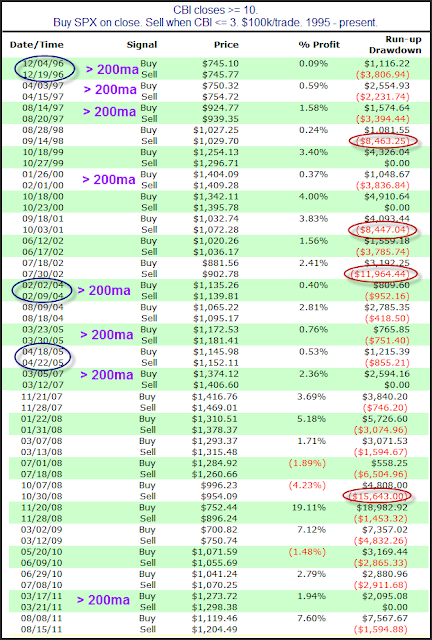
Notable about Friday’s action is that the selling caused the Quantifiable Edges Capitulative Breadth Indicator (CBI) to rise from 7 to 11. We now have the 10+ CBI reading that I have discussed and written so much about over the years. Over the weekend I thought I would examine individual instances of CBI readings of 10+ and look to answer the question “How bad could it get?” The table below again considers the approach of buying the SPX when the CBI hits 10 or higher and then selling when it moves back down to 3 or less.
Before we look at drawdowns you’ll note I circled 3 dates in blue. The current selloff has been a slow-motion meltdown. There hasn’t yet been a down day of 2% or more. The blue circles mark the only other 3 instances where the CBI reached 10 without a single-day decline of 2%+ in the last 10 days. We can’t deduce much from just 3 instances but it is notable how unusual the current selloff has been.
I’ve marked all the other instances that occurred over the 200ma on the table. As you can see, the worst declines were less than 4% from the entry point.
But perhaps you don’t feel these volatility or trend filters are appropriate. In that case you should consider all the other listed instances.
I’ve circled in red above the 4 worst selloffs that occurred after the CBI hit 10. They were in 1998, 2001, 2002, and 2008. All of them were historically notable selloffs. They ranged between 8% and 15.64%. And while 3 of the 4 resulted in profitable trades, an 8%-15% drawdown over a few days can be pretty painful to sit through. I looked at them all closely in last night’s subscriber letter. (Click here for a free trial.) One thing I will note is that they all made their selloff low within 3 days of the CBI crossing 10.

