I have begun sharing one of the Quantifiable Edges Seasonality Calendars each month. Last month, we looked at the NASDAQ. This month the calendar that caught my eye was GLD, the Gold ETF. It looks lousy (technical term term for “sucky”).
The Quantifiable Edges Seasonality Calendar uses multiple systems to measure historical performance on similar days to those on the upcoming calendar. The systems look at filters like time of week, month, year and so forth. Over the long run, staying out of the market on days that do not appear in green, would have been beneficial. To appear in green the date needs to show a historical Win% of 50% or more and a profit factor of 1.0 or more.
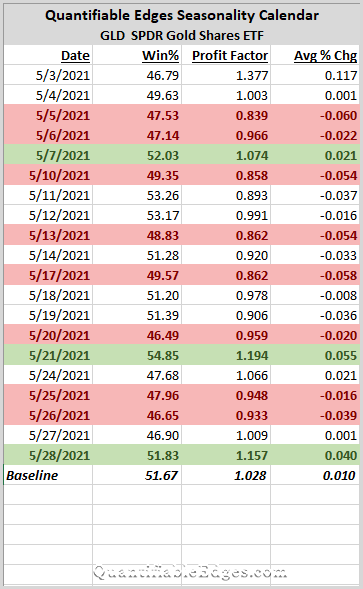
Obviously, what stood out with regards to GLD is how bearish it appears. Only 3 “green” days all month is the worst for any of the 10 indices/securities we publish. The Baseline hurdles are fairly low, and they are rarely exceeded in the May calendar. Seasonality is just one factor, but I have found paying attention to it to be worthwhile. A couple of months ago, I published a research paper that showed the value of avoiding gold on days that did not show favorable seasonality odds. That paper is available to all subscribers, including trial subscribers, on the Quantifiable Edges Seasonality page. It is titled “Gold 50/1 Calendar Model Research”.
Want research like this delivered directly to your inbox on a timely basis? Sign up for the Quantifiable Edges Email List.
How about a free trial to the Quantifiable Edges Gold subscription?