
Historical SPX Performance When Rates Start To Rise

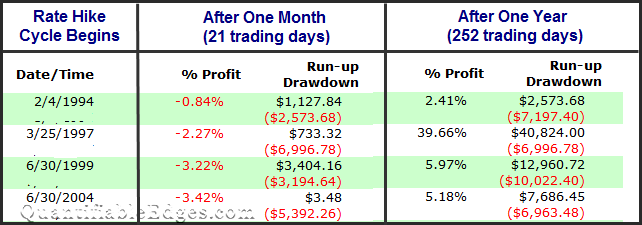
Fed announcing Wednesday that they will begin raising rates for the 1st time in 11 years. Since 1990 there have only been 4 other cycles of rate hikes. I decided to measure SPX performance from the start of those cycles. I found that one month later the stock market was trading lower every time. But one year later it was higher every time. Individual returns (based on $100k/trade) can be found in the table below.
2015-12-17 image1

Of course it is dangerous to draw conclusions from just 4 instances, but I thought it was interesting and somewhat noteworthy nonetheless.

Want research like this delivered directly to your inbox on a timely basis? Sign up for the Quantifiable Edges Email List.

About the author:

Rob Hanna is the founder of Quantifiable Edges, a quantitative market research service he has run since 2008. His research focuses on statistical analysis of U.S. equity markets. In 2009 he published "The Quantifiable Edges Guide to Fed Days," available on Amazon. He was named the 2024 recipient of the National Association of Active Investment Managers (NAAIM) Founders Award and has since joined the NAAIM Board of Directors. Rob also works with Capital Advisors 360 as an investment advisor representative, where he utilizes quantitative and volatility-based models. Follow him on X / Bluesky / StockTwits / Facebook / Substack