For years I have published research about the Quantifiable Edges Capitulative Breadth Indicator (CBI). In fact, the 3rd blog post ever, back in Jan 2008, was about the CBI. On Friday, the CBI jumped from 7 to 11. Over the years I have generally regarded any reading of 10 or higher to be a bullish indication. The study below is one I have shown many times. It looks a performance following a spike to 10 or higher. I also added a 200ma filter.
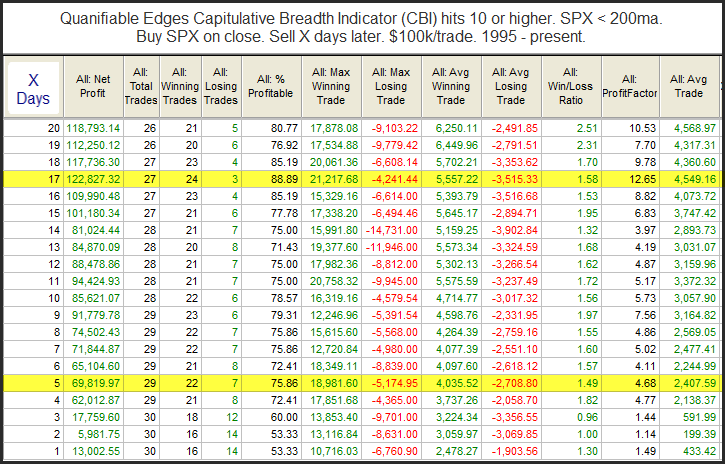
We see that most often during established downtrends the high reading has marked a point where the selling is nearly over (at least temporarily), and bounce is likely to begin. The 17-day curve can be seen below.
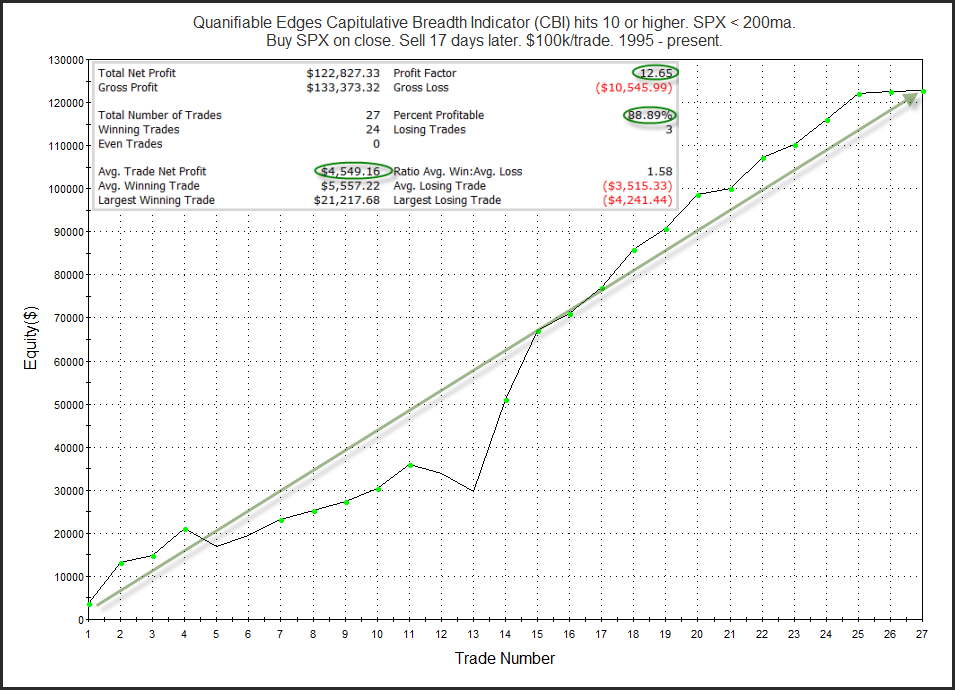
That is solid consistency. It is a wild market we are in. Based on the spike in the CBI to over 10, it appears that there is a good chance that we’ll see a bounce, and perhaps some intermediate-term relief fairly soon. Plenty more CBI research can be found here.
A more detailed version of this study appeared in the Quantifiable Edges Subscriber Letter this past weekend, along with several others. Take a free trial here if you want to see it.
Want research like this delivered directly to your inbox on a timely basis? Sign up for the Quantifiable Edges Email List.
How about a free trial to the Quantifiable Edges Gold subscription?