What The VXO Is Telling Me Now

I like to use the VIX (or VXO) as a tool for timing the market. When looking at the VXO I normally relate it to a short-term moving average rather than looking at absolute levels. Below is one test I ran this weekend that I found particularly interesting.

I looked to see what happened if you bought the S&P 500 under the following conditions:

1) The VXO closes at least 10% above its 10-day moving average for 3 days in a row.
2) The VXO closes at its highest high in the last 10 days.

In other words, fear has been relatively high over the last 3 days and is now at its highest recent point (if you accept that high option premium is indicative of fear among market participants).

$100,000 per trade. Results below:
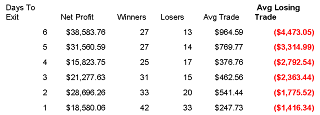
At first glance the results seemed to indicate a decent probability of a bounce and profitable system. Closer examination revealed something even more interesting to me. I’ve bolded the last column which shows the size of the average losing trade. When things go wrong – they go REALLY wrong. The average loss was nearly 4.5% in the S&P over the next 6 days!

Next I added a third condition to the test. I wanted to see what happened when the above circumstances occurred while the market was trading below it’s 200 days moving average (as it is now). Again $100,000 per trade. Even scarier Avg Loss column below:

The probability of a bounce is now down to about 50-50 and the average loss is startling. Nearly 6% downside over the next 6 days for the losing trades!

My interpretation: there’s a good chance we could get a bounce here – but if we don’t…watch out!

Good trading,
Rob Hanna

Potential Leadership Is Lacking

I use several quantitative techniques for my short-term trades (days), and this blog will primarily focus on short-term quantifiable edges. I also trade using intermediate-term timeframes (weeks). My intermediate-term trading has typically been focused around high-growth momentum plays. Each weekend I run scans to come up with a list of candidates that meet my criteria from a fundamental and momentum standpoint. I then scroll through the list of stocks to try and find stocks that appear to be setting up in basing patterns and whittle the original list down to create my weekly watch list (although many stocks I’ll frequently just carry over from the previous week as well).

When evaluating the market’s health, one area I always look at is leadership. I believe strong leadership can generate a lot of buying enthusiasm. Investors become more interested in the market and rallies can generate significant momentum. People see certain stocks breaking out that quickly making huge gains and they want to find the next one. Momentum begets more momentum in this manner. Therefore, not only do I look at leadership, but POTENTIAL leadership. Potential leadership can many times be found in my watch list – for those are the high growth stocks that are on the verge of completing basing formations. If they succeed in breaking out they may become the next leaders.

When looking at whether a potential rally could have legs, I look at what my watch list is telling me. This week my list is saying to me that picking’s are slim. If we do get a bounce here, there seems to be a good chance it will be little more than that. Stocks are going to need some time to form proper bases before breakouts can build the kind of momentum that will spark investor enthusiasm enough to generate a significant bull move.

Rob Hanna