Between vacation the 1st week in April and taxes the 2nd week it’s taken me forever to finalize the March trade results, but they’re finally here. March was the 1st difficult month the Letter has had since last August. There were 2 main culprits – Catpults and Index trades.
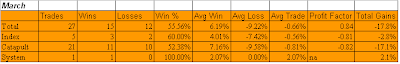
The Catapult trades had their worst bout in a long time. The primary culprit was the single worst trade in the history of the system. As I’ll describe below, the results are just a scorecard and not a portfolio return. The Catapult trades are normally scaled into in 3 lots. I always just list the gain/loss of each lot rather than slicing the results of those that only had one lot on. Since I don’t suggest allocation sizes it hardly matters, but listing each lot can exaggerate results sometimes. In October for instance, the results were exaggerated upwards. This month, downwards. The net additive results of all the Catapult trades was a loss of about 17% on 21 lots – or about -0.8% per lot. The single worst trade I referred to above had 3 lots active and they accounted for a loss of 58%.
To be fair, it wasn’t just the Catapults that faltered. I was too early to enter some of the index trades as the market collapsed in late February / early March. I also took them off too early in the bounce. The net additive result of the 5 index-sized lots was a loss of 2.8%. These positions are typically scaled into as well and they were in March, with a maximum of 4 on at one point. What I did very right was I avoided trying to short the bounce on the initial thrust off the bottom. Many traders that use overbought/oversold methods mistakenly viewed the initial bounce as a simple “overbought in a downtrend” setup. I discussed extensively in the Subscriber Letter that shorting the initial bounce appeared to be a dangerous proposition. The only short index trade idea I took wasn’t until 3/26 and I exited it with a nice 2.9% profit on 3/30.
Other systems were quiet as I often defer to the Catapults in times of market stress. It didn’t work out this time, but it traditionally has (see last October and November for some outstanding examples). There was only 1 system trade idea tracked outside of the Catapults and it went for a decent gain.
April so far has been much more efficient. There have been only a handful of trade ideas that have received fills and results have been strong so far. I’ll get to those results next month, though. Below are some of the usual caveats and explanations followed by March’s results.
As mentioned above, I don’t suggest position sizes. The primary reason for this is I’m not acting as a financial advisor. I don’t feel it is appropriate to suggest allocation sizes without understanding someone’s financial situation and risk tolerance. Even for my own trading I run different portfolios with different levels of aggressiveness. For instance, my most aggressive portfolio is my IRA. Here I may use options to sometimes get 400-500% leveraged. Other portfolios on the other hand normally take much more conservative stances and some rarely reach or exceed 100% exposure.
Since I don’t suggest position sizes this is should not be considered a performance report, but rather a trade idea scorecard. Therefore, no matter how objective I try to be the reporting of the results is always going to be skewed depending on how you approach the trades. For instance, I always recommend scaling into the Catapult positions in 3 parts, whereas the “System” trades (whatever system I unveil other than Catapult) are normally one entry. The “Index” trades I normally recommend scaling into as well. For my own trading I trade much larger size with the index trades than any of the individuals. I also control my exposure by limiting the total amount invested per day. As I mentioned, this will vary depending on the account I’m trading. My most aggressive account I may put in up to 100%/day and get heavily leveraged using options. A more conservative account may max out at 15%-20% per day.
It’s unlikely anyone would have taken all of the trades with equal amounts, so personal results would vary greatly depending on the trader’s approach. Simply adding up the results of the individual triggers as I do below is an admittedly poor representation of returns. A net positive or negative does not necessarily mean a person following the ideas would have made or lost money during the period measured. And the sum total is certainly not representative of what a portfolio would return. All that aside, below are March’s results (click to enlarge):
Detailed trade by trade results will appear in this weekend’s Subscriber Letter. If you haven’t checked out the gold membership area yet, then click here to sign up for a free trial (only a name and email address required). It’s not just trade ideas. It contains research far beyond the blog as well as members-only charts, systems (with code included), and custom indicators.


