A few years back I wrote about Zweig Breadth Thrusts in some detail. The Zweig Thrust takes a 10-day exponential moving average of the NYSE Up Issues %. It looks for a move from < 40% to over 61.5% within a 10-day period to signal there has been a breadth thrust.
Over the last 3 days we have essentially what could be considered the inverse setup trigger. The NYSE Up Issues % 10ema has fallen from above 61.5% to under 40% in 10 trading days. Rather than a breadth thrust, we have seen a “breadth collapse”. I looked back at other times where such an “Inverse Zweig Breadth Collapse” has occurred. I found the setup to be rare. The full list of instances can be found below.
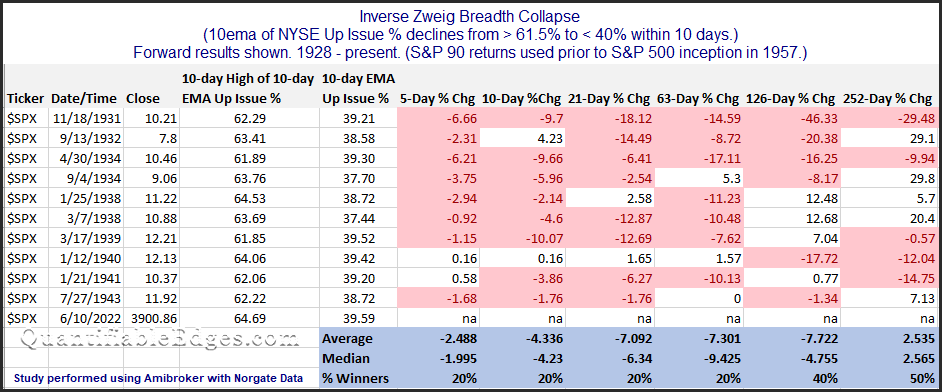
There have only been 10 instances dating back to 1928, and the current instance is the 1st one since 1943, when the S&P 90 was the primary S&P index. The modern S&P 500 inception occurred in 1957. So it is fairly amazing to see a breadth collapse so unusual that it has not happened in nearly 80 years. In looking at all the instances between 1931 and 1943, results were not encouraging for the bulls. On average the market was down 2.5% five days later, down 4.3% ten days later, down 7.1% one month later, down 7.3% three months later, and down 7.7% six months later. I will not put a whole lot of faith in a signal that has not triggered in nearly 80 years. But the fact that we have seen such an extreme breadth collapse the last few days does seem notable. And it sure doesn’t appear to be market positive for the next few months.
This study appeared in this weekend’s Quantifiable Edges Subscriber Letter. You may sign up for a free trial (no obligation and no credit card required) here.