
The strong breadth we have seen recently has caused the 10-day exponential moving average of the NYSE Up Issues % to rise up to 62%. A move through 61.5% after being below 40% within the last 2 weeks is considered a Zweig Breadth Thrust trigger. This is a signal created by Martin Zweig. Over the long haul it has been a rare but powerful signal. Below is a list of all signals since 1970 along with their 20-day returns (using Tradestation data).
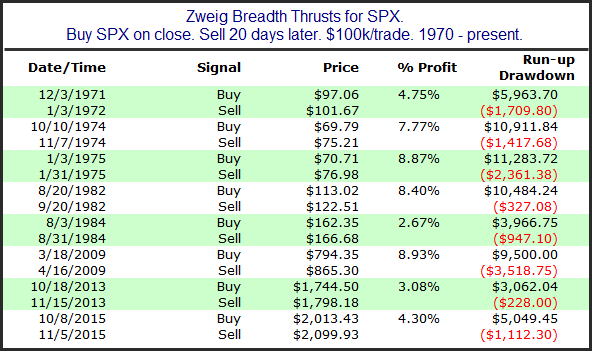
All 8 instances saw a runup of at least 3% over the next 4 weeks, and only once did the market pull back as much as even 2.5%. I last showed this study on the blog in 2015. Today I decided to show SPX charts for all the signals. I have labeled the 20-day holding periods shown above on the charts as well.
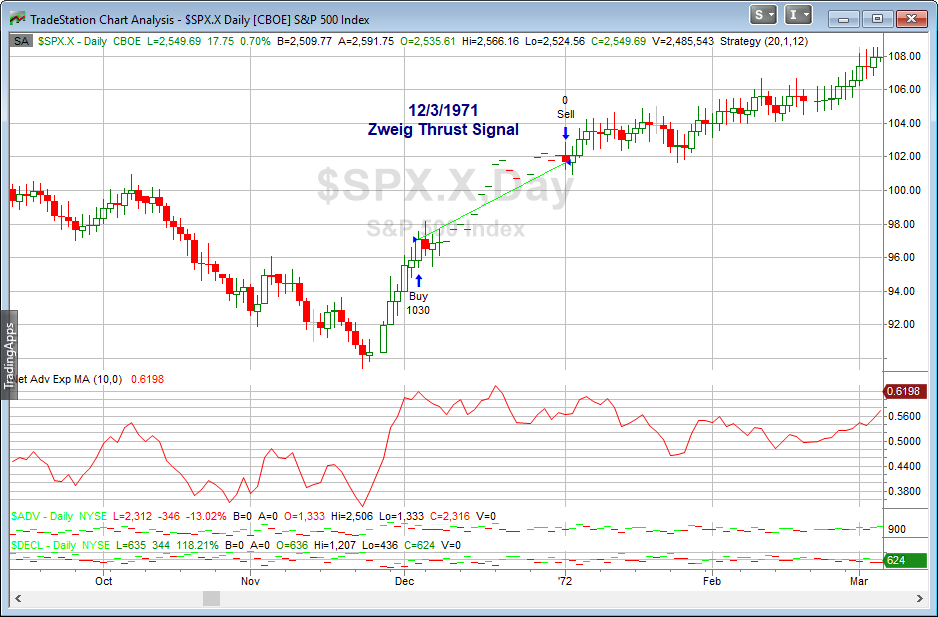
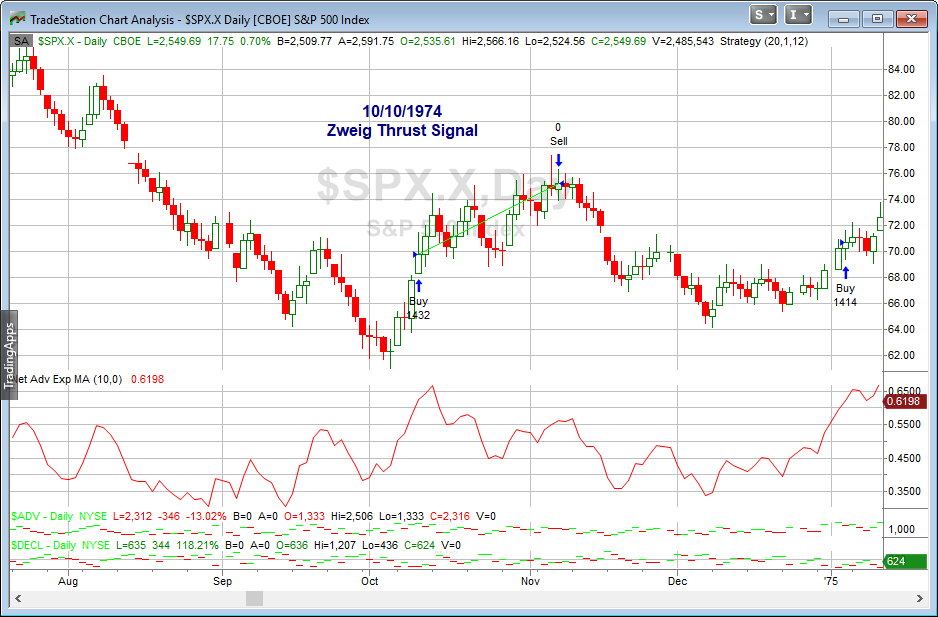
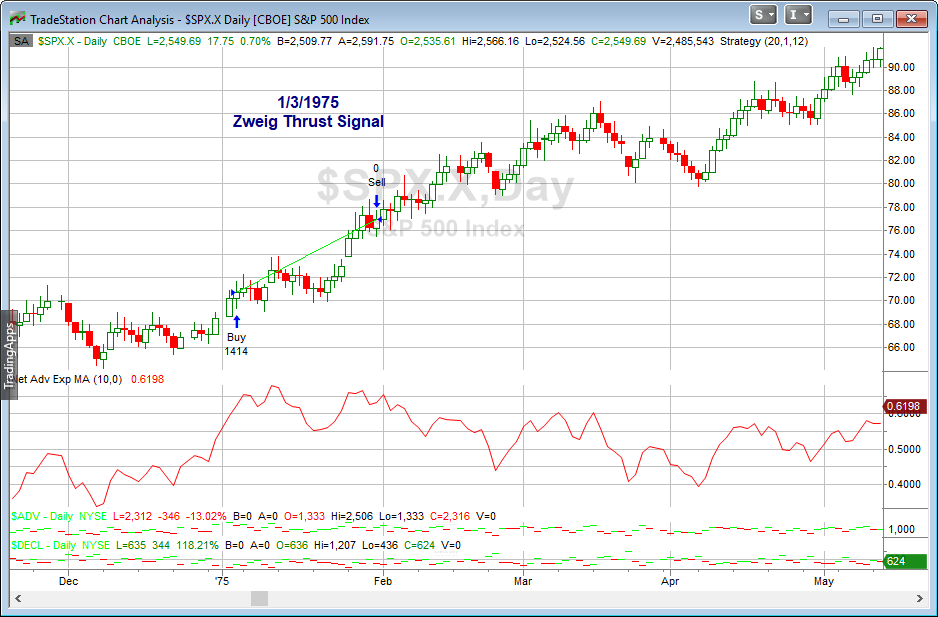
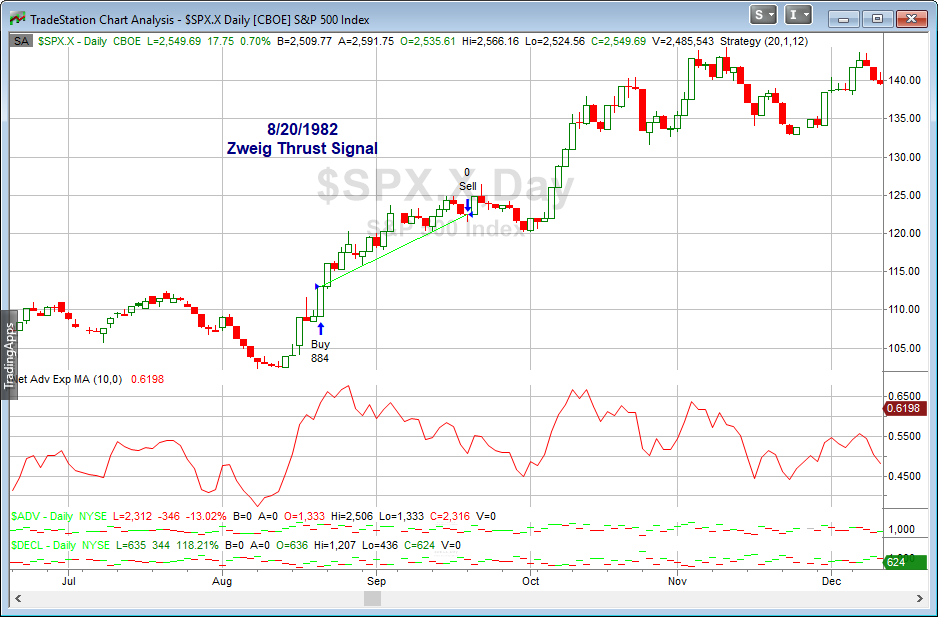
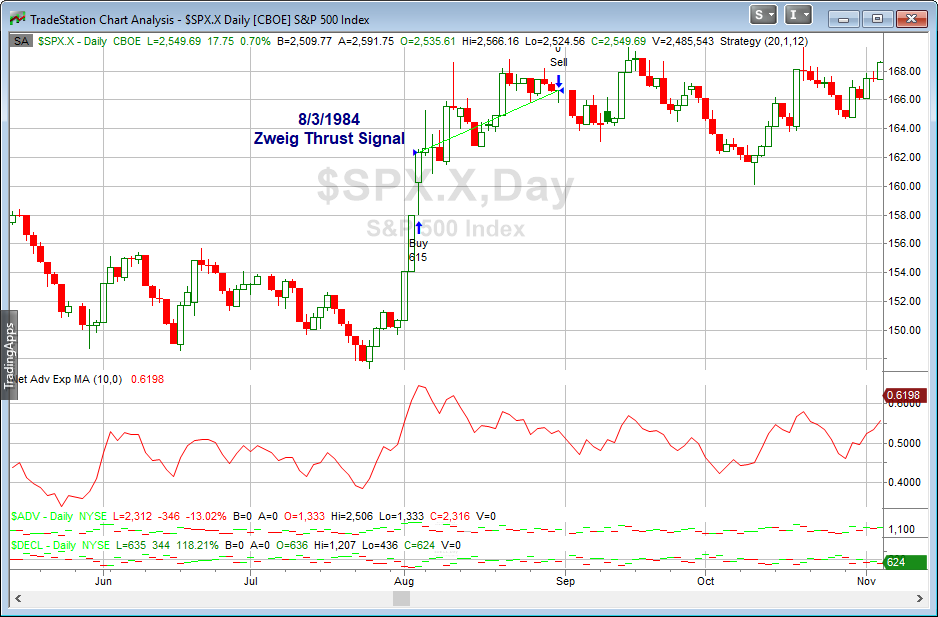
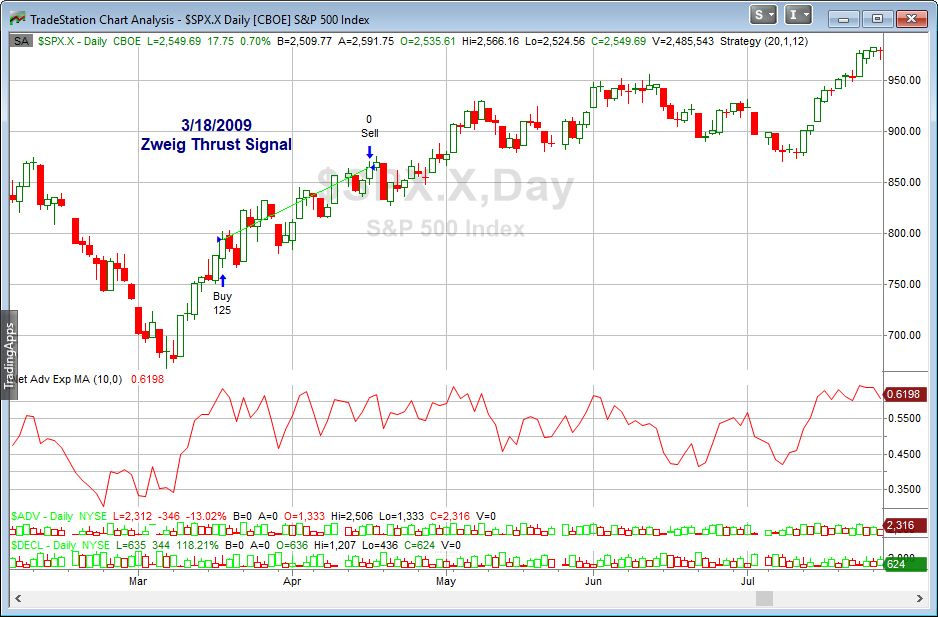
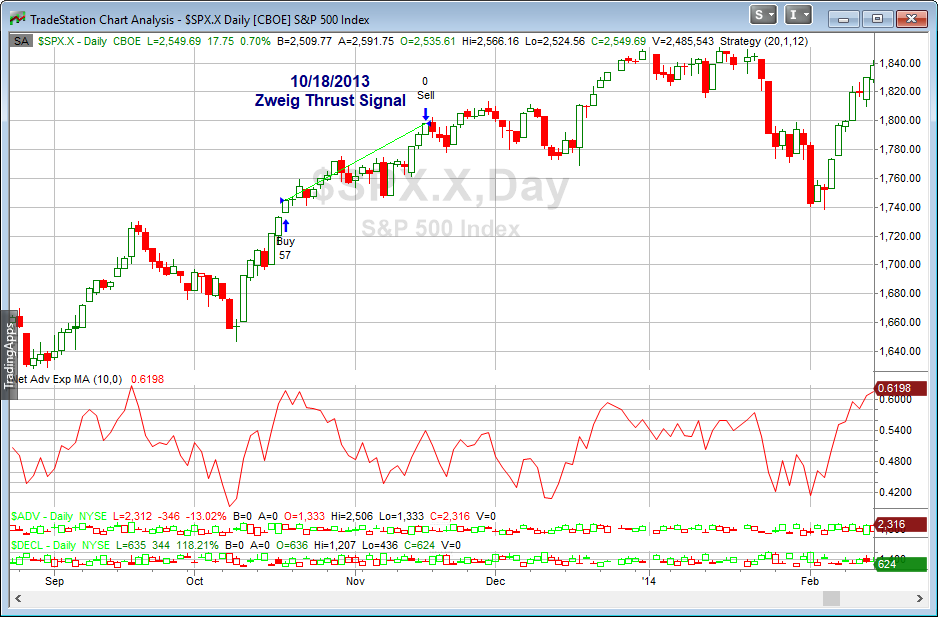
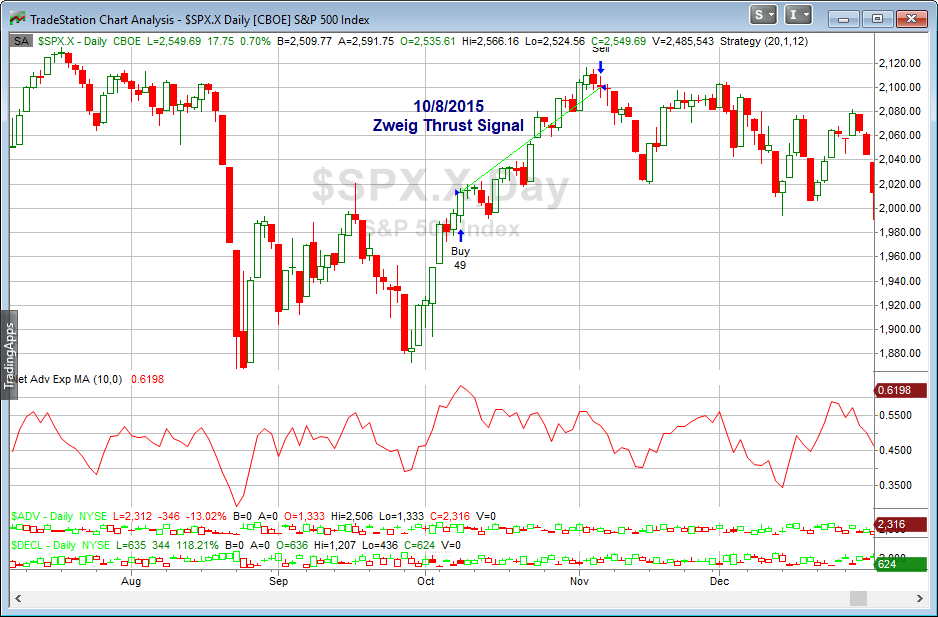
I am seeing some other evidence suggesting a possible pullback in the next few days. But the Zweig Thrust Signal certainly favors the bulls for both the short and intermediate-term. Traders may want to keep it in mind as they determine their trading bias.
Related Quantifiable Edges Studies
- Zweig Breadth Thrust: 7 Triggers Since 1970, All Up in 20 Days
- Inverse Zweig Breadth Collapse: 10 Triggers Since 1928
- Triple-70 Breadth Thrust: 3 Days of NYSE Up Issues Above 70%
- Unprecedented Breadth Thrust Trifecta: Triple 70, BAM & Whaley ADT5
Want research like this delivered directly to your inbox on a timely basis? Sign up for the Quantifiable Edges Email List.