The strong breadth we have seen recently has caused the 10-day exponential moving average of the Up Issues % to rise up to 63.6%. A move through 61.5% after being below 40% within the last 10trading days is considered a Zweig Breadth Thrust trigger. This is a signal created by Martin Zweig. I last discussed it in the 1/8/19 blog. In that post I also showed charts for past signals. Over the long haul Zweig Breadth Thrusts have been rare but powerful. Below is a stats table showing results of all signals since 1957 and summarizing them. (Note I used Norgate Data this time, rather than Tradestation data. That was so I could look back further in time. Data providers data often varies slightly, so we see a 2011 instance below where we did not see that with the Tradestation data a few years back.)
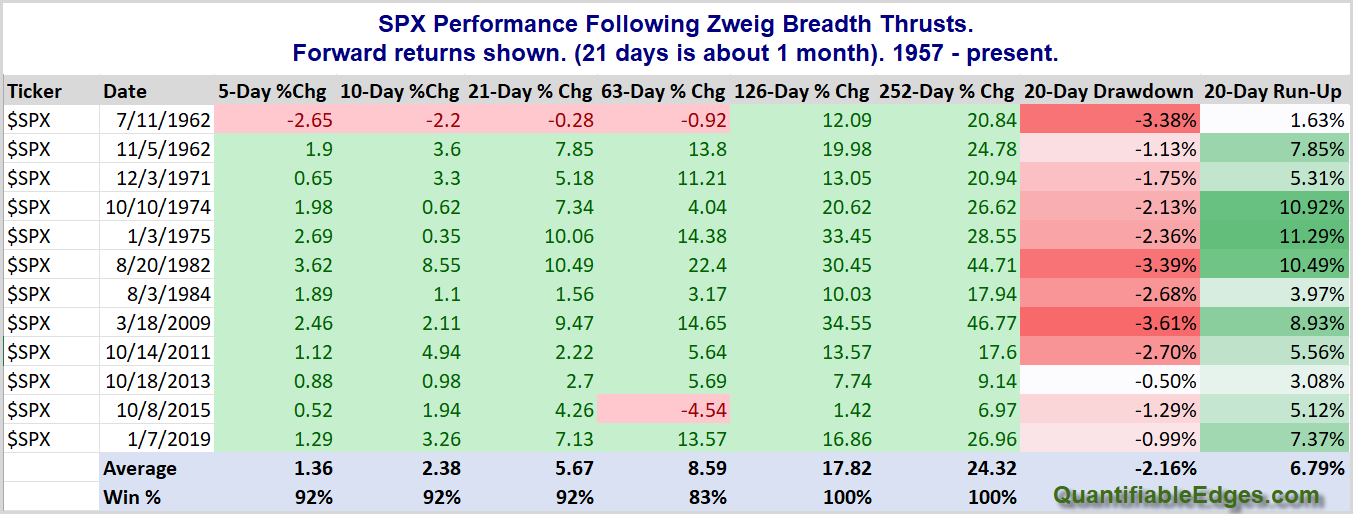
Over the short, intermediate, and long-term there have been strong gains on a consistent basis. The AVG run-up over the next 20 days has been 6.79%. This is double the MAX drawdown, and over triple the average drawdown. Average gains over the next 10 days are 2.4%, 21-days average 5.7%, and the average gain over the next year has been 24.3%. Those are impressive moves. So yes, the market is overbought. But this is a case where the move has been so strong and so broad that strength is likely to beget more strength.
Want research like this delivered directly to your inbox on a timely basis? Sign up for the Quantifiable Edges Email List.
How about a free trial to the Quantifiable Edges Gold subscription?