As the early February volatility explosion unfolded, it was difficult to anticipate when the selling would reach a level that the market would find a bottom (at least temporarily). The selloff exceeded historical levels based on % changes in range and volatility increases. One indicator that once again demonstrated its worth was the Quantifiable Edges Capitualtive Breadth Indicator (CBI). The CBI quickly spiked to 25 and then continued up as high as 31 in the ensuing days. I noted the initial spike here on the blog, and tweeted (@QuantEdges) updates over the following days and weeks.
One CBI-based strategy I have shown in the past involves going long the S&P 500 when the CBI spikes to 10 or higher, and then exiting the position on a return to a “neutral” CBI level of 3 or lower. The chart below shows how this approach would have worked out during the February market.
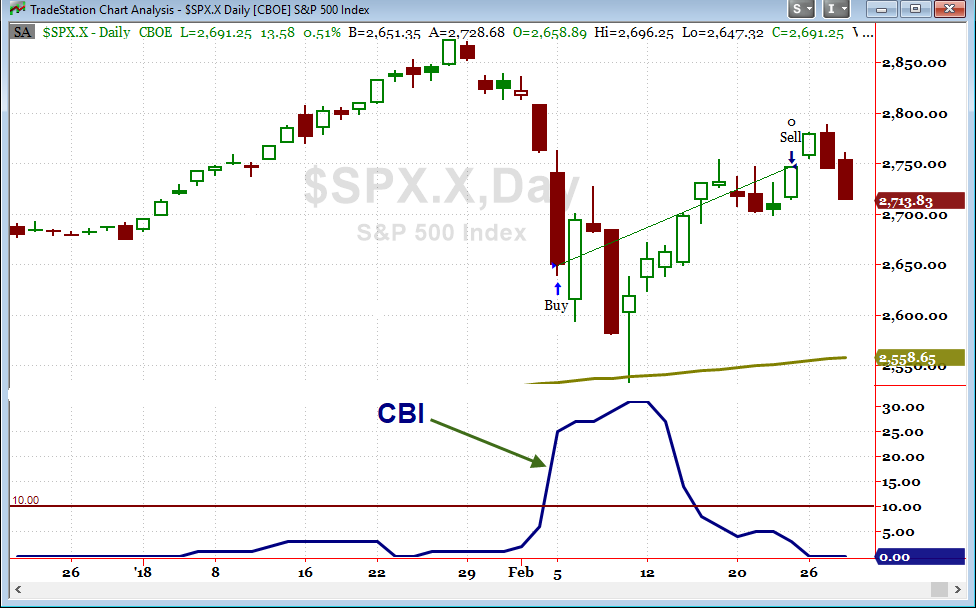
In this case, the selling was not over, and another brief leg down would have had to be endured to take advantage of the strategy. But those that utilized the edge and showed the fortitude to hold until the CBI again turned neutral were again rewarded.
Below are updated hypothetical stats for the strategy. ($0 commissions assumed.)
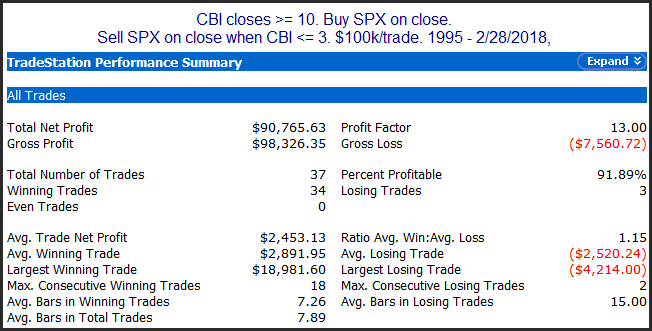
Numbers here are quite impressive and suggest a strong bullish edge. Lastly, the profit curve:
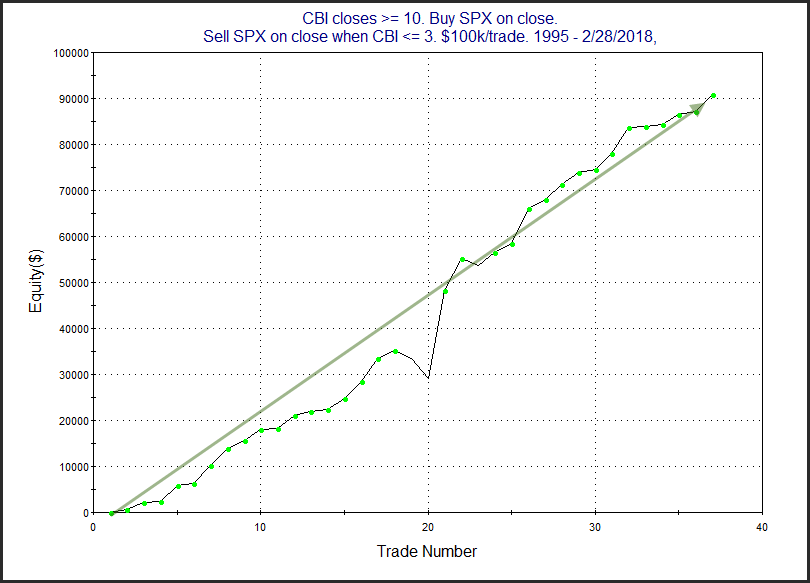
The strong, steady upslope serves as some confirmation of the bullish edge suggested by the numbers.
Even before starting Quantifiable Edges in 2008, the CBI was one of my favorite indicators for identifying selling capitulation that is highly likely to be followed by short to intermediate-term market rallies. And it has always been a staple at Quantifiable Edges. In fact, the 3rd post I ever did was about the CBI.
Later this week I will be releasing the most detailed analysis I have ever done of the CBI. I will show charts of market action during and after every spike since 1995. I will share a detailed spreadsheet with breakdown and stats of all such CBI spikes. And I will show many additional studies as well as strategies traders can incorporate into their own methods. And it will all be free of charge. I’d encourage traders to keep an eye out for it.
Want research like this delivered directly to your inbox on a timely basis? Sign up for the Quantifiable Edges Email List.